OPEN-SOURCE SCRIPT
업데이트됨 SuperThree
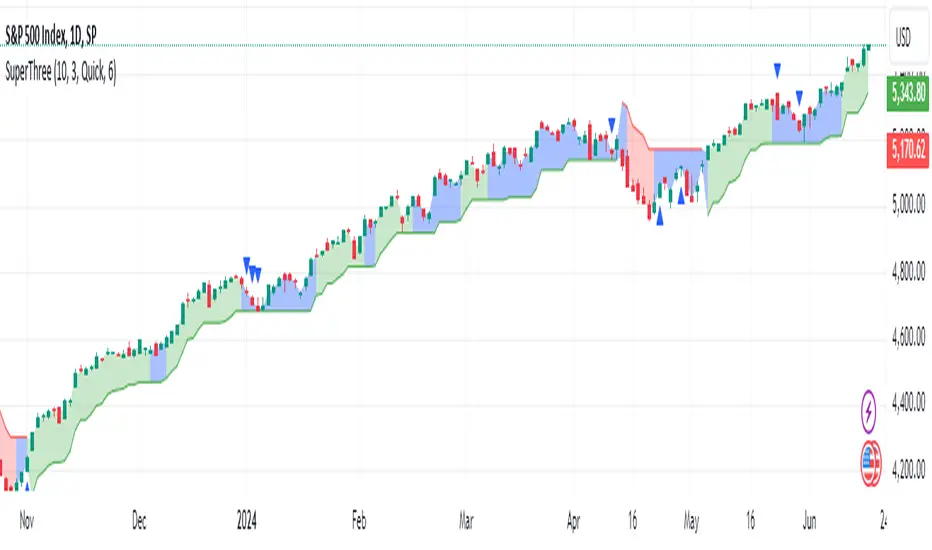
The SuperThree is a comprehensive technical indicator designed to identify and visualize market trends and counter-trend momentum in trading. It uses a unique color-coding system to represent different market conditions and potential trading opportunities.
The SuperThree indicator is an enhancement of the Supertrend indicator, providing additional features and visual cues to help traders make informed decisions. However, like all indicators, it should be used in conjunction with other forms of analysis to confirm signals and avoid potential false positives. Always consider your risk tolerance and investment goals before making trading decisions.
Happy trading! 😊
- Uptrend (Green Fill): This is indicated by a green fill. An uptrend is a period where prices are increasing overall, suggesting a strong market. It’s an ideal time for traders to consider entering long positions or exiting short positions.
- Downtrend (Red Fill): This is represented by a red fill. A downtrend is a period where prices are decreasing overall, indicating a bearish market. Traders might consider entering short positions or exiting long positions during this phase.
- Sideways Trend (Blue Fill): This is shown by a blue fill. A sideways trend, also known as a horizontal trend, is when the price is relatively stable and not making significant upward or downward movements. It’s often a period of consolidation before the price moves up or down.
- Counter-Trend Momentum (Blue Arrows): Blue arrows indicate counter-trend momentum, which can be a signal to exit trades or look for potential trend reversals. These are crucial points where the market’s momentum is shifting and may be about to move in the opposite direction.
The SuperThree indicator is an enhancement of the Supertrend indicator, providing additional features and visual cues to help traders make informed decisions. However, like all indicators, it should be used in conjunction with other forms of analysis to confirm signals and avoid potential false positives. Always consider your risk tolerance and investment goals before making trading decisions.
Happy trading! 😊
릴리즈 노트
SuperThree Indicator CalculationThe SuperThree indicator is an enhanced version of the Supertrend, designed to identify uptrends, downtrends, sideways trends, and counter-trend momentum in the market. Below is a detailed explanation of the calculation and methodology used to determine these trends and momentum.
1. ATR-Based Bands:
- ATR (Average True Range) is calculated over a specified period (default is 10).
- The upper band is determined by adding a multiple of the ATR to the average price ((high + low) / 2).
- The lower band is calculated by subtracting the ATR multiple from the average price.
- The multiple used (default is 3) can be adjusted to fit different market conditions.
2. Trend Direction:
- Trend Bands: The bands are adjusted based on previous values to ensure they only move in the direction of the trend.
- SuperTrend Calculation: The SuperTrend value switches between the upper and lower bands based on the closing price. If the closing price is above the upper band, the SuperTrend follows the lower band and vice versa.
- Trend Direction: A positive or negative direction is assigned based on the relationship between the current closing price and the SuperTrend value.
3. Trend Confirmation:
Trend Band Configuration: Depending on the selected mode (Strict, Quick, Quicker), the trend confirmation varies:
- Strict: Uses the SuperTrend value for confirmation.
- Quick: Uses adjusted upper/lower bands for faster trend identification.
- Quicker: Uses basic bands for even quicker trend changes.
Directional Check: The trend direction is determined by comparing the trend bands over the past three bars and confirming with the current and previous closing prices.
4. Trend Identification:
- Uptrend: Identified when the trend band is rising over the last three bars and the closing price is higher than both the open and the previous candle's close.
- Downtrend: Identified when the trend band is falling over the last three bars and the closing price is lower than both the open and the previous candle's close.
- Sideways Trend: Recognized when the trend band remains flat over the last three bars and is confirmed by the relationship between the current and previous closing prices.
- Trend Continuation: If the trend from the previous bar persists, it is continued.
5. Counter-Trend Momentum:
- Counter-Trend Identification: It calculates the average gap between the closing price and the SuperTrend over the current direction and compares it to a predefined threshold.
- Bearish Momentum: Identified if the closing price, direction, and band movement indicate a possible downward reversal.
- Bullish Momentum: Identified if the closing price, direction, and band movement indicate a possible upward reversal.
Plotting in the Chart
- Uptrend: Filled with green when identified.
- Downtrend: Filled with red when identified.
- Sideways Trend: Filled with blue when identified.
- Counter-Trend Momentum: Displayed with blue arrows (triangles) above or below the bar, indicating potential bearish or bullish momentum, respectively.
오픈 소스 스크립트
트레이딩뷰의 진정한 정신에 따라, 이 스크립트의 작성자는 이를 오픈소스로 공개하여 트레이더들이 기능을 검토하고 검증할 수 있도록 했습니다. 작성자에게 찬사를 보냅니다! 이 코드는 무료로 사용할 수 있지만, 코드를 재게시하는 경우 하우스 룰이 적용된다는 점을 기억하세요.
면책사항
해당 정보와 게시물은 금융, 투자, 트레이딩 또는 기타 유형의 조언이나 권장 사항으로 간주되지 않으며, 트레이딩뷰에서 제공하거나 보증하는 것이 아닙니다. 자세한 내용은 이용 약관을 참조하세요.
오픈 소스 스크립트
트레이딩뷰의 진정한 정신에 따라, 이 스크립트의 작성자는 이를 오픈소스로 공개하여 트레이더들이 기능을 검토하고 검증할 수 있도록 했습니다. 작성자에게 찬사를 보냅니다! 이 코드는 무료로 사용할 수 있지만, 코드를 재게시하는 경우 하우스 룰이 적용된다는 점을 기억하세요.
면책사항
해당 정보와 게시물은 금융, 투자, 트레이딩 또는 기타 유형의 조언이나 권장 사항으로 간주되지 않으며, 트레이딩뷰에서 제공하거나 보증하는 것이 아닙니다. 자세한 내용은 이용 약관을 참조하세요.