OPEN-SOURCE SCRIPT
Monthly Returns with Benchmark
I keep working on trying to make TradingView strategies look fancier.
A few months ago I published the first version of the Monthly Returns for Strategies in Pine Script. I received quite a lot of good feedback and quite a lot of requests to update it.
This is a more advanced version of the Monthly Returns, in it, you can:
I hope it will be useful for you.
It's not about the strategy itself but the way you display returns on your chart. So pls don't critique my choice of the strategy and its performance 🙂
Disclaimer
Please remember that past performance may not be indicative of future results.
Due to various factors, including changing market conditions, the strategy may no longer perform as well as in historical backtesting.
This post and the script don’t provide any financial advice.
A few months ago I published the first version of the Monthly Returns for Strategies in Pine Script. I received quite a lot of good feedback and quite a lot of requests to update it.
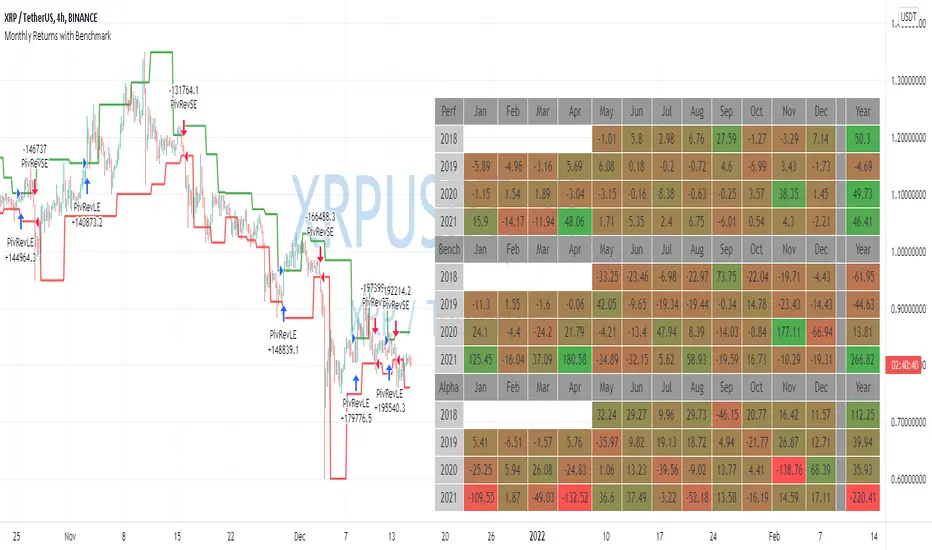
This is a more advanced version of the Monthly Returns, in it, you can:
- Display monthly returns of your strategy, benchmark, and alpha over this benchmark.
- Select benchmark to be another instrument
- Select the date from which you want to compute monthly returns
- Show/hide benchmark and alpha
- Choose colors for gradient for gain/loss values
- Use it with any type of strategy
- Use it with replay
I hope it will be useful for you.
It's not about the strategy itself but the way you display returns on your chart. So pls don't critique my choice of the strategy and its performance 🙂
Disclaimer
Please remember that past performance may not be indicative of future results.
Due to various factors, including changing market conditions, the strategy may no longer perform as well as in historical backtesting.
This post and the script don’t provide any financial advice.
오픈 소스 스크립트
트레이딩뷰의 진정한 정신에 따라, 이 스크립트의 작성자는 이를 오픈소스로 공개하여 트레이더들이 기능을 검토하고 검증할 수 있도록 했습니다. 작성자에게 찬사를 보냅니다! 이 코드는 무료로 사용할 수 있지만, 코드를 재게시하는 경우 하우스 룰이 적용된다는 점을 기억하세요.
🎓 Pine Script 6 Course: qntly.com/ps6
💼 Hire Us: qntly.com/pine
📰 qntly.com/news
𝕏: qntly.com/x
📩 qntly.com/tel
💼 Hire Us: qntly.com/pine
📰 qntly.com/news
𝕏: qntly.com/x
📩 qntly.com/tel
면책사항
해당 정보와 게시물은 금융, 투자, 트레이딩 또는 기타 유형의 조언이나 권장 사항으로 간주되지 않으며, 트레이딩뷰에서 제공하거나 보증하는 것이 아닙니다. 자세한 내용은 이용 약관을 참조하세요.