INVITE-ONLY SCRIPT
Franco Varacalli binary options
|ENGLISH|
What if you could know, with mathematical precision, when your trades have the highest probability of success?
Franco V. ~ Stats is not just an indicator: it’s a real-time performance tracking and analysis system that transforms price action into clear, actionable metrics.
🔍 What it does
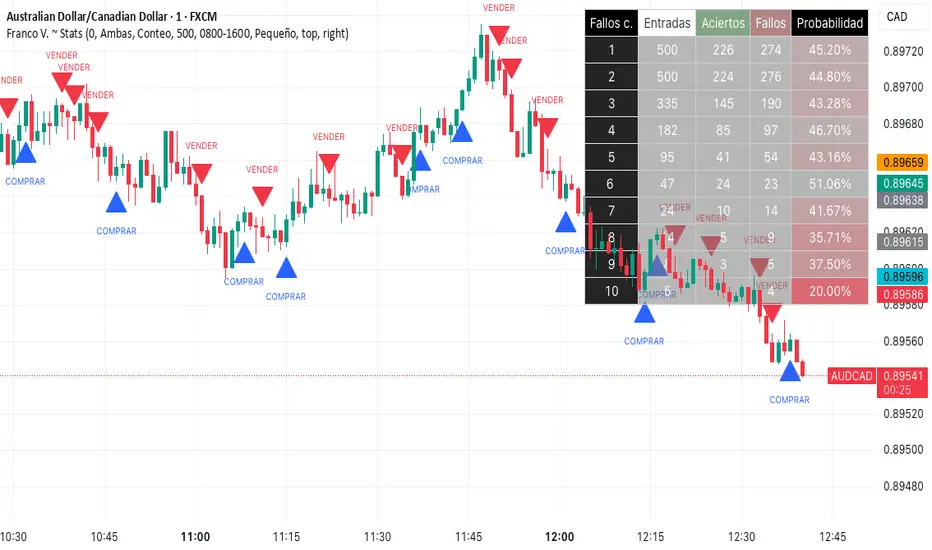
It analyzes candle sequences and detects changes in price dynamics, filtering opportunities according to your settings (buy only, sell only, or both). From there, it records each entry, counts wins and losses, and calculates success probabilities for different scenarios.
🛠 How it works (core concepts)
-Evaluates proportional relationships between open, close, high, and low prices.
-Detects shifts in the balance of buying/selling pressure.
-Classifies trades by the number of prior consecutive losses.
-Calculates success probabilities based on accumulated historical data.
📈 What you get
-On-chart table showing entries, wins, losses, and win percentage.
-Dynamic colors to instantly spot the best-performing scenarios.
-Optional arrows marking moments when conditions are met.
-Filters and thresholds to adapt the analysis to your trading style.
💡 How to use it
-Set your preferred signal type and consecutive loss threshold.
-Monitor the table to see which sequences show higher probability.
-Use the signals as a reference and confirm with your own technical analysis.
⚠ Disclaimer: This tool is designed for market analysis and performance tracking. It should be used in combination with your own research, risk management, and decision-making process.
Franco Varacalli
What if you could know, with mathematical precision, when your trades have the highest probability of success?
Franco V. ~ Stats is not just an indicator: it’s a real-time performance tracking and analysis system that transforms price action into clear, actionable metrics.
🔍 What it does
It analyzes candle sequences and detects changes in price dynamics, filtering opportunities according to your settings (buy only, sell only, or both). From there, it records each entry, counts wins and losses, and calculates success probabilities for different scenarios.
🛠 How it works (core concepts)
-Evaluates proportional relationships between open, close, high, and low prices.
-Detects shifts in the balance of buying/selling pressure.
-Classifies trades by the number of prior consecutive losses.
-Calculates success probabilities based on accumulated historical data.
📈 What you get
-On-chart table showing entries, wins, losses, and win percentage.
-Dynamic colors to instantly spot the best-performing scenarios.
-Optional arrows marking moments when conditions are met.
-Filters and thresholds to adapt the analysis to your trading style.
💡 How to use it
-Set your preferred signal type and consecutive loss threshold.
-Monitor the table to see which sequences show higher probability.
-Use the signals as a reference and confirm with your own technical analysis.
⚠ Disclaimer: This tool is designed for market analysis and performance tracking. It should be used in combination with your own research, risk management, and decision-making process.
Franco Varacalli
초대 전용 스크립트
이 스크립트는 작성자가 승인한 사용자만 접근할 수 있습니다. 사용하려면 요청 후 승인을 받아야 하며, 일반적으로 결제 후에 허가가 부여됩니다. 자세한 내용은 아래 작성자의 안내를 따르거나 franco_varacalli에게 직접 문의하세요.
트레이딩뷰는 스크립트의 작동 방식을 충분히 이해하고 작성자를 완전히 신뢰하지 않는 이상, 해당 스크립트에 비용을 지불하거나 사용하는 것을 권장하지 않습니다. 커뮤니티 스크립트에서 무료 오픈소스 대안을 찾아보실 수도 있습니다.
작성자 지시 사항
If you would like access, please click "Send Message" and include your a confirmation of your Tradingview username. Si deseas obtener acceso, haz clic en "Enviar mensaje" e incluye una confirmación de tu nombre de usuario de TradingView.
면책사항
해당 정보와 게시물은 금융, 투자, 트레이딩 또는 기타 유형의 조언이나 권장 사항으로 간주되지 않으며, 트레이딩뷰에서 제공하거나 보증하는 것이 아닙니다. 자세한 내용은 이용 약관을 참조하세요.