OPEN-SOURCE SCRIPT
Cot Histogram | Mercor
Cot Histogram | Mercor
Overview:
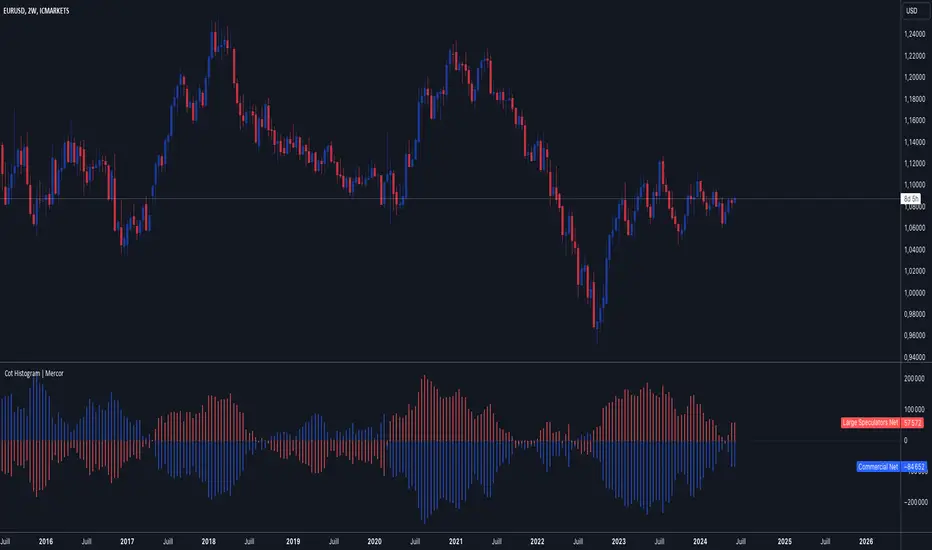
The Cot Histogram | Mercor indicator provides a comprehensive visualization of the Commitment of Traders (COT) report data using bar charts. This indicator is designed to help traders analyze the positions held by commercial traders and large speculators in various markets. By representing the data as histograms, traders can easily interpret the long and short positions, as well as the net positions of these market participants.
Originality:
What sets the Cot Histogram | Mercor indicator apart is its unique approach to visualizing COT data using bar charts instead of traditional line charts. This method offers a clearer representation of the data, making it easier for traders to spot trends and changes in market sentiment. Additionally, the indicator allows for customization of colors and bar widths, providing a tailored experience for each user.
Features:
Show Shorts as Negative Numbers: This option allows users to display short positions as negative values, providing a more intuitive visualization.
Invert Colors: Users can invert the default colors for long and short positions, enabling better contrast and visual preference.
Bar Width: Adjust the width of the histogram bars to suit personal preferences and chart aesthetics.
Concepts Underlying the Calculations:
The Commitment of Traders (COT) report is a weekly publication by the Commodity Futures Trading Commission (CFTC) that provides a breakdown of the open interest positions of market participants in futures markets. This indicator focuses on two main categories of traders:
The indicator calculates and plots the following metrics:
How to Use:
Load the Indicator: Add the Cot Histogram | Mercor indicator to your TradingView chart.
Customize Settings: Adjust the settings according to your preferences:
Enable or disable the "Show Shorts as Negative Numbers" option.
Invert the colors if needed.
Adjust the bar width for better visual representation.
Interpret the Data: Use the histograms to analyze the market positions:
Commercial Long and Short: Observe the positions held by commercial traders. Increasing long positions may indicate hedging against potential price increases, while increasing short positions may suggest hedging against potential price decreases.
Large Speculators Long and Short: Monitor the positions of large speculators to gauge market sentiment. A rise in long positions by large speculators often indicates bullish sentiment, while a rise in short positions suggests bearish sentiment.
Net Positions: The net positions provide a clearer picture of the overall stance of commercial traders and large speculators.
Example:
If you notice that commercial traders are increasing their long positions while large speculators are increasing their short positions, it may indicate a divergence in market expectations between hedgers and speculators. This could be a signal to further investigate potential market reversals or confirm existing trends.
By leveraging the Cot Histogram | Mercor indicator, traders can gain valuable insights into market dynamics, improve their trading strategies, and make more informed decisions. Whether you are a long-term investor or a short-term trader, understanding the positions of different market participants can provide a significant edge in the markets.
Overview:
The Cot Histogram | Mercor indicator provides a comprehensive visualization of the Commitment of Traders (COT) report data using bar charts. This indicator is designed to help traders analyze the positions held by commercial traders and large speculators in various markets. By representing the data as histograms, traders can easily interpret the long and short positions, as well as the net positions of these market participants.
Originality:
What sets the Cot Histogram | Mercor indicator apart is its unique approach to visualizing COT data using bar charts instead of traditional line charts. This method offers a clearer representation of the data, making it easier for traders to spot trends and changes in market sentiment. Additionally, the indicator allows for customization of colors and bar widths, providing a tailored experience for each user.
Features:
Show Shorts as Negative Numbers: This option allows users to display short positions as negative values, providing a more intuitive visualization.
Invert Colors: Users can invert the default colors for long and short positions, enabling better contrast and visual preference.
Bar Width: Adjust the width of the histogram bars to suit personal preferences and chart aesthetics.
Concepts Underlying the Calculations:
The Commitment of Traders (COT) report is a weekly publication by the Commodity Futures Trading Commission (CFTC) that provides a breakdown of the open interest positions of market participants in futures markets. This indicator focuses on two main categories of traders:
The indicator calculates and plots the following metrics:
How to Use:
Load the Indicator: Add the Cot Histogram | Mercor indicator to your TradingView chart.
Customize Settings: Adjust the settings according to your preferences:
Enable or disable the "Show Shorts as Negative Numbers" option.
Invert the colors if needed.
Adjust the bar width for better visual representation.
Interpret the Data: Use the histograms to analyze the market positions:
Commercial Long and Short: Observe the positions held by commercial traders. Increasing long positions may indicate hedging against potential price increases, while increasing short positions may suggest hedging against potential price decreases.
Large Speculators Long and Short: Monitor the positions of large speculators to gauge market sentiment. A rise in long positions by large speculators often indicates bullish sentiment, while a rise in short positions suggests bearish sentiment.
Net Positions: The net positions provide a clearer picture of the overall stance of commercial traders and large speculators.
Example:
If you notice that commercial traders are increasing their long positions while large speculators are increasing their short positions, it may indicate a divergence in market expectations between hedgers and speculators. This could be a signal to further investigate potential market reversals or confirm existing trends.
By leveraging the Cot Histogram | Mercor indicator, traders can gain valuable insights into market dynamics, improve their trading strategies, and make more informed decisions. Whether you are a long-term investor or a short-term trader, understanding the positions of different market participants can provide a significant edge in the markets.
오픈 소스 스크립트
트레이딩뷰의 진정한 정신에 따라, 이 스크립트의 작성자는 이를 오픈소스로 공개하여 트레이더들이 기능을 검토하고 검증할 수 있도록 했습니다. 작성자에게 찬사를 보냅니다! 이 코드는 무료로 사용할 수 있지만, 코드를 재게시하는 경우 하우스 룰이 적용된다는 점을 기억하세요.
면책사항
해당 정보와 게시물은 금융, 투자, 트레이딩 또는 기타 유형의 조언이나 권장 사항으로 간주되지 않으며, 트레이딩뷰에서 제공하거나 보증하는 것이 아닙니다. 자세한 내용은 이용 약관을 참조하세요.
오픈 소스 스크립트
트레이딩뷰의 진정한 정신에 따라, 이 스크립트의 작성자는 이를 오픈소스로 공개하여 트레이더들이 기능을 검토하고 검증할 수 있도록 했습니다. 작성자에게 찬사를 보냅니다! 이 코드는 무료로 사용할 수 있지만, 코드를 재게시하는 경우 하우스 룰이 적용된다는 점을 기억하세요.
면책사항
해당 정보와 게시물은 금융, 투자, 트레이딩 또는 기타 유형의 조언이나 권장 사항으로 간주되지 않으며, 트레이딩뷰에서 제공하거나 보증하는 것이 아닙니다. 자세한 내용은 이용 약관을 참조하세요.