OPEN-SOURCE SCRIPT
업데이트됨 Intraday Super Sectors
Motivated by Cody to finish what I'd started ...
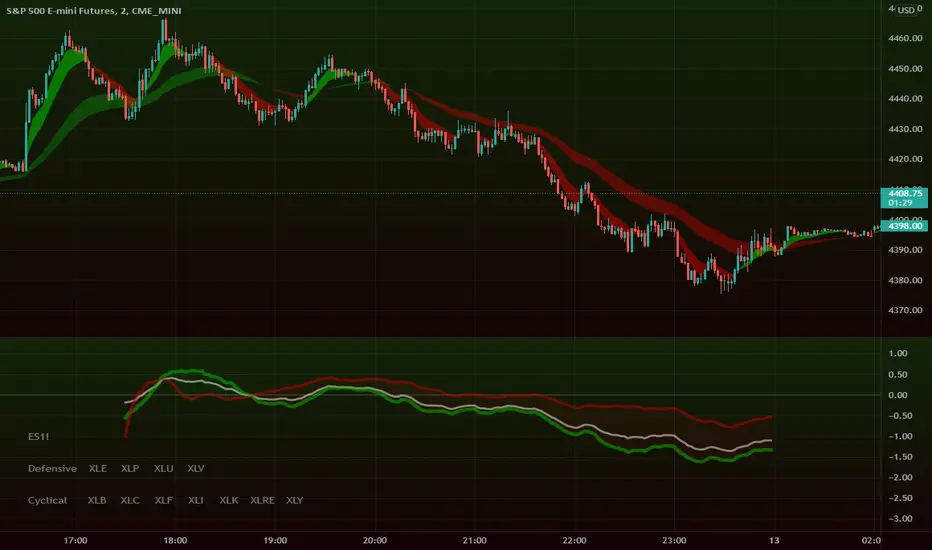
This indicator plots the two 'Super Sectors' (Cyclical and Defensive) intraday change, viz-a-viz SPX price
* for convenience, it uses the ETF's, rather than the actual sectors. This might make it 0.0001% inaccurate.
For reference:
Defensive Sectors:
XLE Energy (not always considered a true defensive sector, but I've thrown it in here for balance)
XLP Consumer Staples
XLU Utilities
XLV Health Care
Cyclical Sectors:
XLB Materials
XLC Communication Services
XLF Financials
XLI Industrials
XLK Information Technology
XLRE Real Estate
XLY Consumer Discretionary
Why the (soft) red/green cloud?
Well, the theory says is that if the Cyclical Sector is down, while the Defensive Sector is up, this isn't exactly bullish (so a soft red cloud), or if Defensive Stocks are down, while Cyclical Stocks are up, this is perhaps bullish.
Of course, if SPX is down 10%, with Defensive Stocks down 20%, and Cyclical Stocks down 5%, you might get a green cloud, but it ain't exactly a bullish sign
릴리즈 노트
New Features!* User can choose whether a sector is 'Cyclical' or 'Defensive'
* User can display spaghetti, if they really want!
Minor Bug Fix
* Small (display-related only) value fix
릴리즈 노트
Updated to cater for main charts that show trading hours outside the regular cash session (e.g. ES1!)If you're just displaying SPX, no need to change these sessions
If you're displaying extended hours, please change the settings:
a) 'Extended Hours'
b) Is it Summer Time (daylight savings) or Winter Time?
Outside of the cash session, the indicator is dormant (don't worry - it'll come to life at 09:30!)
오픈 소스 스크립트
트레이딩뷰의 진정한 정신에 따라, 이 스크립트의 작성자는 이를 오픈소스로 공개하여 트레이더들이 기능을 검토하고 검증할 수 있도록 했습니다. 작성자에게 찬사를 보냅니다! 이 코드는 무료로 사용할 수 있지만, 코드를 재게시하는 경우 하우스 룰이 적용된다는 점을 기억하세요.
면책사항
해당 정보와 게시물은 금융, 투자, 트레이딩 또는 기타 유형의 조언이나 권장 사항으로 간주되지 않으며, 트레이딩뷰에서 제공하거나 보증하는 것이 아닙니다. 자세한 내용은 이용 약관을 참조하세요.
오픈 소스 스크립트
트레이딩뷰의 진정한 정신에 따라, 이 스크립트의 작성자는 이를 오픈소스로 공개하여 트레이더들이 기능을 검토하고 검증할 수 있도록 했습니다. 작성자에게 찬사를 보냅니다! 이 코드는 무료로 사용할 수 있지만, 코드를 재게시하는 경우 하우스 룰이 적용된다는 점을 기억하세요.
면책사항
해당 정보와 게시물은 금융, 투자, 트레이딩 또는 기타 유형의 조언이나 권장 사항으로 간주되지 않으며, 트레이딩뷰에서 제공하거나 보증하는 것이 아닙니다. 자세한 내용은 이용 약관을 참조하세요.