OPEN-SOURCE SCRIPT
Finnie's RSI with EMA crossover + Stoch
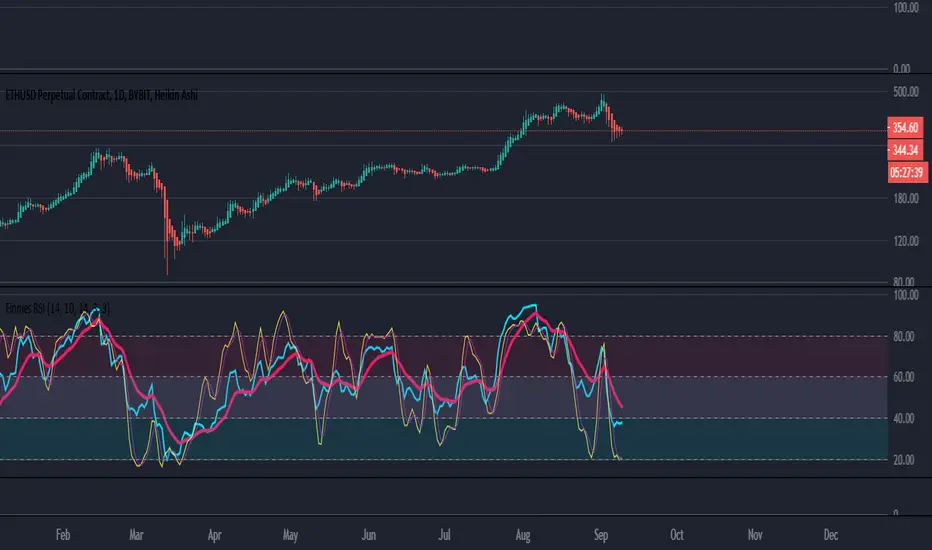
RSI seams to be one of the most used indicators by far, and that comes because of merit. With that in mind, the goal of this indicator is to expand upon the tradition RSI or Relative Strength Index we all know and love :) I started by adding an EMA crossover. Which gives you, the users, a general idea of when to buy and sell outside of just watching a line go down and up. To take thinks even further, I decided to add options for both Fast and Slow Stochastic oscillators. Adding STOCH brings in another variable when deciding on an entry, technically its a bit hard to explain but in practice it would go something like this: you notice RSI is down around the level 20 mark and RSI is crossing up above it's EMA, which is BULLISH signal, and you're thinking about going long. As a second confirmation you can look at the STOCH rsi, if it's also crossing above the previously spoken EMA that's another BULLISH signal. This process can be repeated once RSI has risen to find an exit.
EDIT: If you find the indicator is a bit too cluttered for you, feel free to disable the 'STOCH rsi' feature in settings :)
EDIT: If you find the indicator is a bit too cluttered for you, feel free to disable the 'STOCH rsi' feature in settings :)
오픈 소스 스크립트
트레이딩뷰의 진정한 정신에 따라, 이 스크립트의 작성자는 이를 오픈소스로 공개하여 트레이더들이 기능을 검토하고 검증할 수 있도록 했습니다. 작성자에게 찬사를 보냅니다! 이 코드는 무료로 사용할 수 있지만, 코드를 재게시하는 경우 하우스 룰이 적용된다는 점을 기억하세요.
면책사항
해당 정보와 게시물은 금융, 투자, 트레이딩 또는 기타 유형의 조언이나 권장 사항으로 간주되지 않으며, 트레이딩뷰에서 제공하거나 보증하는 것이 아닙니다. 자세한 내용은 이용 약관을 참조하세요.
오픈 소스 스크립트
트레이딩뷰의 진정한 정신에 따라, 이 스크립트의 작성자는 이를 오픈소스로 공개하여 트레이더들이 기능을 검토하고 검증할 수 있도록 했습니다. 작성자에게 찬사를 보냅니다! 이 코드는 무료로 사용할 수 있지만, 코드를 재게시하는 경우 하우스 룰이 적용된다는 점을 기억하세요.
면책사항
해당 정보와 게시물은 금융, 투자, 트레이딩 또는 기타 유형의 조언이나 권장 사항으로 간주되지 않으며, 트레이딩뷰에서 제공하거나 보증하는 것이 아닙니다. 자세한 내용은 이용 약관을 참조하세요.