OPEN-SOURCE SCRIPT
업데이트됨 Statistical Footprint
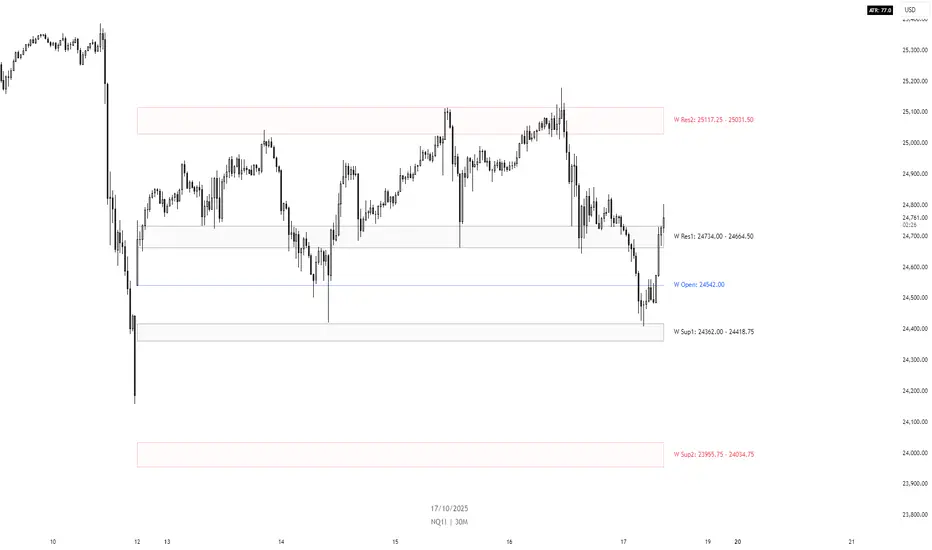
Statistical Footprint - Behavioral Support & Resistance
This indicator identifies key price levels based on actual market behavior rather than traditional pivot calculations. It analyzes how bulls and bears have historically moved price from session opens, creating statistical zones where future reactions are most likely.
The concept is simple: track how far bullish candles typically push above the open versus how far bearish candles drop below it. These patterns reveal the market's behavioral "footprint" - showing where momentum typically stalls and reverses.
Key Features:
- Separate analysis for daily and weekly timeframes
- Smart zone merging when levels cluster together (within 5 points)
- Uses both mean and median calculations for more robust levels
- XGBoost-optimized lookback periods for maximum statistical significance
- Clean zone-only display focused on actionable price areas
How it Works:
The code separates bullish and bearish sessions, measuring their typical range extensions from the open. It then projects these statistical ranges forward from current session opens, creating "behavioral zones" where the market has historically shown consistent reactions.
When daily and weekly levels align closely, they merge into combined zones with enhanced significance. Labels show both the mean and median values when they differ meaningfully.
Best Used For:
- Identifying high-probability reversal zones
- Setting profit targets based on historical behavior
- Understanding market sentiment shifts at key levels
- Confluence analysis between different timeframes
The lookback periods have been optimized using machine learning to find the most predictive historical sample sizes for current market conditions.
릴리즈 노트
Update: Updated the daily and weekly values to be more accurate.
릴리즈 노트
Updated the name to Fancy Zones.릴리즈 노트
Updated name.릴리즈 노트
Updated to version 3.0.This updates includes a few logic updates, visual updates, and cleanup.
오픈 소스 스크립트
트레이딩뷰의 진정한 정신에 따라, 이 스크립트의 작성자는 이를 오픈소스로 공개하여 트레이더들이 기능을 검토하고 검증할 수 있도록 했습니다. 작성자에게 찬사를 보냅니다! 이 코드는 무료로 사용할 수 있지만, 코드를 재게시하는 경우 하우스 룰이 적용된다는 점을 기억하세요.
면책사항
해당 정보와 게시물은 금융, 투자, 트레이딩 또는 기타 유형의 조언이나 권장 사항으로 간주되지 않으며, 트레이딩뷰에서 제공하거나 보증하는 것이 아닙니다. 자세한 내용은 이용 약관을 참조하세요.
오픈 소스 스크립트
트레이딩뷰의 진정한 정신에 따라, 이 스크립트의 작성자는 이를 오픈소스로 공개하여 트레이더들이 기능을 검토하고 검증할 수 있도록 했습니다. 작성자에게 찬사를 보냅니다! 이 코드는 무료로 사용할 수 있지만, 코드를 재게시하는 경우 하우스 룰이 적용된다는 점을 기억하세요.
면책사항
해당 정보와 게시물은 금융, 투자, 트레이딩 또는 기타 유형의 조언이나 권장 사항으로 간주되지 않으며, 트레이딩뷰에서 제공하거나 보증하는 것이 아닙니다. 자세한 내용은 이용 약관을 참조하세요.