INVITE-ONLY SCRIPT
업데이트됨 Convergence/divergence indicator
Convergence/divergence indicator (CDI)
Class: arbitrage oscillator
Trading type: intraday trading
Time frame: 1 hour
Purpose: trading on divergence
Level of aggressiveness: standard
Arbitrage - several logically related transactions aimed at profit from the difference in prices for the same or related assets at the same time in different markets.
Pair trading is a trading strategy based on trading a pair of financial instruments that have some fundamental or statistical relationship, expressed in the fact that the price ratio of these instruments tends to return to a certain average value in the long term.
“Convergence/divergence indicator (CDI)” using correlation analysis from different time frames provides information about statistical relationship between pair of assets.
Correaltion - a statistical relationship between two variables, showing that a larger value (in the case of positive, direct correlation) or a smaller (in the case of negative, inverse correlation) corresponds to a larger value of one value in a certain part of the cases.
The correlation coefficient is a statistical measure of the strength of the relationship between the relative movements of two variables.
The values range between -1.0 and 1.0.
A correlation of -1.0 shows a perfect negative correlation, while a correlation of 1.0 shows a perfect positive correlation.
A correlation of 0.0 shows no linear relationship between the movement of the two variables.
“Convergence/divergence indicator (CDI)” a) allows to find assets where pair arbitrage is possible and determines the moments in time and prices when the conditions for pair arbitrage are ideal.
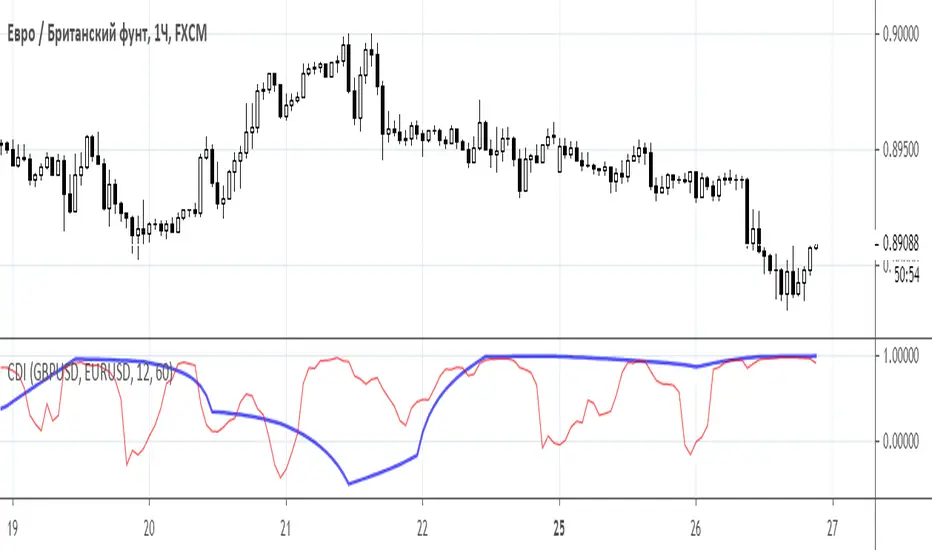
“Convergence/divergence indicator (CDI)” evaluates the statistical relationship between pair of assets in a particular period of time and, if it is available, seeks for the divergence in price fluctuations of these “identical” assets.
“Convergence/divergence indicator (CDI)” displays the current value and dynamics of the Pearson correlation coefficient for a pair of selected assets based on daily (thick blue line) and hourly (thin red line) data.
Basic parameters:
- asset 1 (name of the trading instrument 1);
- asset 2 (name of the trading instrument 2);
- period_d (number of periods used to calculate daily correlation).
- period_h (number of periods used to calculate hourly correlation).
To gain the access to this indicator, please, send a private message to Trade24Fx.
Class: arbitrage oscillator
Trading type: intraday trading
Time frame: 1 hour
Purpose: trading on divergence
Level of aggressiveness: standard
Arbitrage - several logically related transactions aimed at profit from the difference in prices for the same or related assets at the same time in different markets.
Pair trading is a trading strategy based on trading a pair of financial instruments that have some fundamental or statistical relationship, expressed in the fact that the price ratio of these instruments tends to return to a certain average value in the long term.
“Convergence/divergence indicator (CDI)” using correlation analysis from different time frames provides information about statistical relationship between pair of assets.
Correaltion - a statistical relationship between two variables, showing that a larger value (in the case of positive, direct correlation) or a smaller (in the case of negative, inverse correlation) corresponds to a larger value of one value in a certain part of the cases.
The correlation coefficient is a statistical measure of the strength of the relationship between the relative movements of two variables.
The values range between -1.0 and 1.0.
A correlation of -1.0 shows a perfect negative correlation, while a correlation of 1.0 shows a perfect positive correlation.
A correlation of 0.0 shows no linear relationship between the movement of the two variables.
“Convergence/divergence indicator (CDI)” a) allows to find assets where pair arbitrage is possible and determines the moments in time and prices when the conditions for pair arbitrage are ideal.
“Convergence/divergence indicator (CDI)” evaluates the statistical relationship between pair of assets in a particular period of time and, if it is available, seeks for the divergence in price fluctuations of these “identical” assets.
“Convergence/divergence indicator (CDI)” displays the current value and dynamics of the Pearson correlation coefficient for a pair of selected assets based on daily (thick blue line) and hourly (thin red line) data.
Basic parameters:
- asset 1 (name of the trading instrument 1);
- asset 2 (name of the trading instrument 2);
- period_d (number of periods used to calculate daily correlation).
- period_h (number of periods used to calculate hourly correlation).
To gain the access to this indicator, please, send a private message to Trade24Fx.
릴리즈 노트
Converted into Pine Script 5.0.Generator of alerts is added.
Additional variable are incorporated:
- Hourly correlation bottom - responsible for the alert, when hourly correlation goes below threshold (0.2 by default)
- Hourly correlation top - responsible for the alert, when hourly correlation goes above threshold (0.7 by default)
In case of alert function activation indicator will initate an alert if hourly corelation is below "Hourly correlation bottom" or if hourly corelation is above "Hourly correlation top."
초대 전용 스크립트
이 스크립트는 작성자가 승인한 사용자만 접근할 수 있습니다. 사용하려면 요청 후 승인을 받아야 하며, 일반적으로 결제 후에 허가가 부여됩니다. 자세한 내용은 아래 작성자의 안내를 따르거나 Trade24Fx에게 직접 문의하세요.
트레이딩뷰는 스크립트의 작동 방식을 충분히 이해하고 작성자를 완전히 신뢰하지 않는 이상, 해당 스크립트에 비용을 지불하거나 사용하는 것을 권장하지 않습니다. 커뮤니티 스크립트에서 무료 오픈소스 대안을 찾아보실 수도 있습니다.
작성자 지시 사항
To gain the access to this indicator, please, send a private message to Trade24Fx.
Авторские индикаторы
bit.ly/2oBvkHY
Больше информации на нашем ютьюб-канале
youtube.com/channel/UCYEOurJfasXWyYnrriGwsqQ
bit.ly/2oBvkHY
Больше информации на нашем ютьюб-канале
youtube.com/channel/UCYEOurJfasXWyYnrriGwsqQ
면책사항
해당 정보와 게시물은 금융, 투자, 트레이딩 또는 기타 유형의 조언이나 권장 사항으로 간주되지 않으며, 트레이딩뷰에서 제공하거나 보증하는 것이 아닙니다. 자세한 내용은 이용 약관을 참조하세요.