OPEN-SOURCE SCRIPT
업데이트됨 Ultra Volume Detector
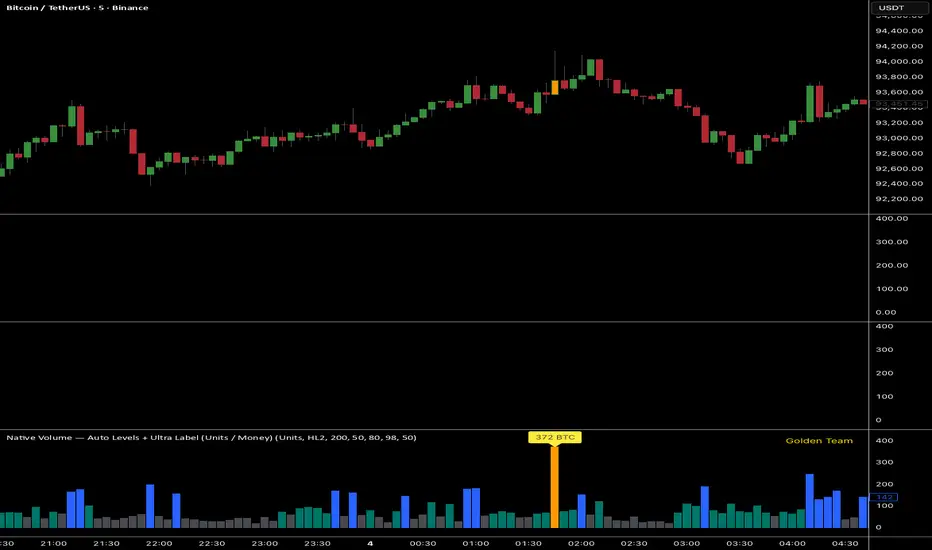
Native Volume — Auto Levels + Ultra Label
What it does
This indicator classifies volume bars into four categories — Low, Medium, High, and Ultra — using rolling percentile thresholds. Instead of fixed cutoffs, it adapts dynamically to recent market activity, making it useful across different symbols and timeframes. Ultra-high volume bars are highlighted with labels showing compacted values (K/M/B/T) and the appropriate unit (shares, contracts, ticks, etc.).
Core Logic
Dynamic thresholds: Calculates percentile levels (e.g., 50th, 80th, 98th) over a user-defined window of bars.
Categorization: Bars are colored by category (Low/Med/High/Ultra).
Ultra labeling: Only Ultra bars are labeled, preventing chart clutter.
Optional MA: A moving average of raw volume can be plotted for context.
Alerts: Supports both alert condition for Ultra events and dynamic alert() messages that include the actual volume value at bar close.
How to use
Adjust window size: Larger windows (e.g., 200+) provide stable thresholds; smaller windows react more quickly.
Set percentiles: Typical defaults are 50 for Medium, 80 for High, and 98 for Ultra. Lower the Ultra percentile to see more frequent signals, or raise it to isolate only extreme events.
Read chart signals:
Bar colors show the category.
Labels appear only on Ultra bars.
Alerts can be set up for automatic notification when Ultra volume occurs.
Why it’s unique
Adaptive: Uses rolling statistics, not static thresholds.
Cross-asset ready: Adjusts units automatically depending on instrument type.
Efficient visualization: Focuses labels only on the most significant events, reducing noise.
⚠️ Disclaimer: This tool is for educational and analytical purposes only. It does not provide financial advice. Always test and manage risk before trading live
릴리즈 노트
add money volume릴리즈 노트
add candle color오픈 소스 스크립트
트레이딩뷰의 진정한 정신에 따라, 이 스크립트의 작성자는 이를 오픈소스로 공개하여 트레이더들이 기능을 검토하고 검증할 수 있도록 했습니다. 작성자에게 찬사를 보냅니다! 이 코드는 무료로 사용할 수 있지만, 코드를 재게시하는 경우 하우스 룰이 적용된다는 점을 기억하세요.
면책사항
해당 정보와 게시물은 금융, 투자, 트레이딩 또는 기타 유형의 조언이나 권장 사항으로 간주되지 않으며, 트레이딩뷰에서 제공하거나 보증하는 것이 아닙니다. 자세한 내용은 이용 약관을 참조하세요.
오픈 소스 스크립트
트레이딩뷰의 진정한 정신에 따라, 이 스크립트의 작성자는 이를 오픈소스로 공개하여 트레이더들이 기능을 검토하고 검증할 수 있도록 했습니다. 작성자에게 찬사를 보냅니다! 이 코드는 무료로 사용할 수 있지만, 코드를 재게시하는 경우 하우스 룰이 적용된다는 점을 기억하세요.
면책사항
해당 정보와 게시물은 금융, 투자, 트레이딩 또는 기타 유형의 조언이나 권장 사항으로 간주되지 않으며, 트레이딩뷰에서 제공하거나 보증하는 것이 아닙니다. 자세한 내용은 이용 약관을 참조하세요.