INVITE-ONLY SCRIPT
업데이트됨 UncleBo

UncleBo looks for the institutional finger prints, the whales or the big boys.
Looks for price, volume , momentum analysis tools and COMBINES the most famous indicators.
Works for any kind of market.
Only thing you have to do is forget about any indicator you used before and look at lines. This helps you overcome your emotions.
Looks for price, volume , momentum analysis tools and COMBINES the most famous indicators.
Works for any kind of market.
Only thing you have to do is forget about any indicator you used before and look at lines. This helps you overcome your emotions.
릴리즈 노트
UncleBo indicator looks for 1- Price Analysis
2- Momentum Analysis
3- Volume Analysis
--------------------------------------
Combines all 3 different analysis tools for trading.
Comes up with at least 3 reasons every trade to show:
a- Buy sign With Lime
b- Strong Buy sign With Orange
c- Sell sign With Maroon
d- Strong Sell sign With Red
--------------------------------------
The bands of UncleBo indicates a buy over 236 or a sell lower -236
The maximum value that the line in UncleBo can max get is 1000 and min get is -1000. As a result, we use the 61.8 levels to also
indicate Buy Or Sell Zones. And, the area between is a neutral sign.
--------------------------------------
UncleBo indicator should be USED in Daily time frame. It is designed to find the charts that looks promising to buy by having 3 unique reasons
UncleBo combines 3 different analysis tools looking at location-price, momentum, and volume.
As a result, UncleBo is 3 INDICATORS COMBINED in one indicator to HELP YOU
1- Set your alarms when the interested coins are in the levels (recommended higher than 236 levels, 61.8 level on the range for -1000 and 1000) that generates 3 unique reasons to buy or sell.
2- Go thorough every coin with less than you have ever spent since you only need to look at 1 INDICATOR.
3- Understand any kind of market state.
4- Fastens the process of overcoming your emotions and justifying one indicator instead of looking for 3 unique indicators.
5- Automatically combines all the indicators calculated for price, momentum, and volume. And draws a line for buy, strong buy, sell, strong sell or neutral.
--------------------------------------
릴리즈 노트
-Solved issue for different time frames-Recommended usage is daily but can be used in 1W-1D-240min-60min time frames too now.
릴리즈 노트
For more details and inquiries please pm me. I will share this unique indicator to anyone who likes and commends his or her thoughts. Positive Mental Attitude For The Win :)
릴리즈 노트
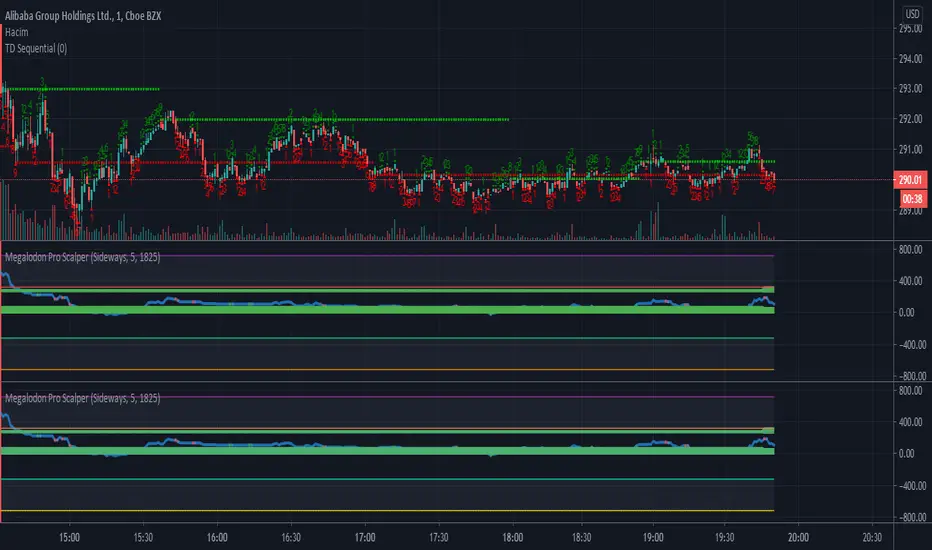
THEMEGALODON theMegalodon looks for the institutional finger prints, the whales or the big boys.
theMegalodon is really simple to use.
theMegalodon combines the 8 different unique indicators, that each have almost perfect success rate.
theMegalodon works with any kind of market state, any kind of trading, and any kind of asset.
theMegalodon has more features than any other indicator in the market: Out of 9 working indicators, we have 3 momentum, 3 price and 3 volume indicators showing you the best signals.
--------------------------------------
theMegalodon is designed for us, the small fishes in the ocean, the millennials, the college students. This will basically makes us the new Megalodons(whale hunters).
All you have to do is:
1- Look for green or red arrows.
2- Look for orange or red candles.
3- Repeat
--------------------------------------
TECHNICAL DETAILS
Some boring info that you don't necessarily need to know.
1- Draws fibonacci retracement (s)' levels depending on your preferred look back period (Default: 365 and 120)
i) Can draw 2 fibs on the same chart. Can reverse the fib levels. Even, add an additional fib level to look for.
ii) Automatic fill function for a Reload Zone inside of a Reload Zone. *61.8% levels to 100% levels or 0% levels
2- Changes the color of the candle when strong buy(orange) or strong sell(red). Draws arrows on the chart for long and short positions.
i) Analyses and Combines
a) Price
b) Momentum
c) Volume
3- Prints out the indicators that are either giving Short or Long signs on the right corner.
4- The closer the unclebo indicator(click enable UncleBo) gets to the All time high, the better buy it is.
i) Same with the other way around. The closer it gets to the 0, the better sell it is.
5- Draws Bollinger Bands on the chart and shows where to buy or sell
6-The indicator is designed to be used in Daily time frame for the best calls to short or long.
--------------------------------------------------
iPyra◬
Enlighten others
릴리즈 노트
Don't forget to follow us on telegram.릴리즈 노트
UltimateMegalodon Early Access for iPyra Team릴리즈 노트
Adjustments - Drawing changed릴리즈 노트
Longer Term Trade Updated릴리즈 노트
New Indicator update초대 전용 스크립트
이 스크립트는 작성자가 승인한 사용자만 접근할 수 있습니다. 사용하려면 요청 후 승인을 받아야 하며, 일반적으로 결제 후에 허가가 부여됩니다. 자세한 내용은 아래 작성자의 안내를 따르거나 MegalodonTrading에게 직접 문의하세요.
트레이딩뷰는 스크립트의 작동 방식을 충분히 이해하고 작성자를 완전히 신뢰하지 않는 이상, 해당 스크립트에 비용을 지불하거나 사용하는 것을 권장하지 않습니다. 커뮤니티 스크립트에서 무료 오픈소스 대안을 찾아보실 수도 있습니다.
작성자 지시 사항
Telegram Here t.me/bugrasukas
면책사항
해당 정보와 게시물은 금융, 투자, 트레이딩 또는 기타 유형의 조언이나 권장 사항으로 간주되지 않으며, 트레이딩뷰에서 제공하거나 보증하는 것이 아닙니다. 자세한 내용은 이용 약관을 참조하세요.
초대 전용 스크립트
이 스크립트는 작성자가 승인한 사용자만 접근할 수 있습니다. 사용하려면 요청 후 승인을 받아야 하며, 일반적으로 결제 후에 허가가 부여됩니다. 자세한 내용은 아래 작성자의 안내를 따르거나 MegalodonTrading에게 직접 문의하세요.
트레이딩뷰는 스크립트의 작동 방식을 충분히 이해하고 작성자를 완전히 신뢰하지 않는 이상, 해당 스크립트에 비용을 지불하거나 사용하는 것을 권장하지 않습니다. 커뮤니티 스크립트에서 무료 오픈소스 대안을 찾아보실 수도 있습니다.
작성자 지시 사항
Telegram Here t.me/bugrasukas
면책사항
해당 정보와 게시물은 금융, 투자, 트레이딩 또는 기타 유형의 조언이나 권장 사항으로 간주되지 않으며, 트레이딩뷰에서 제공하거나 보증하는 것이 아닙니다. 자세한 내용은 이용 약관을 참조하세요.