OPEN-SOURCE SCRIPT
Maancyclus Volatiliteitsindicator (2025)
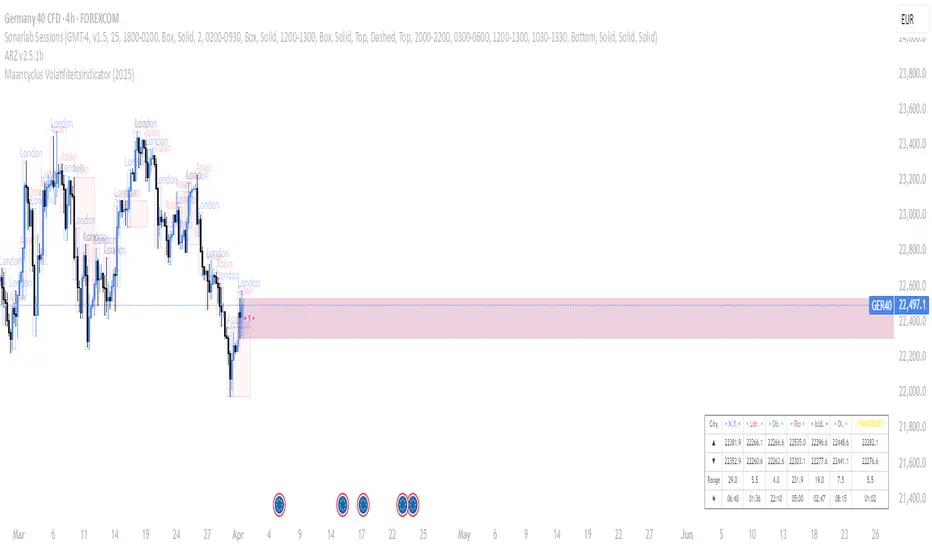
This Moon Cycle Volatility Indicator for TradingView is designed to help traders track and analyze market volatility around specific lunar phases, namely the Full Moon and New Moon. The indicator marks the dates of these moon phases on the chart and measures volatility using the Average True Range (ATR) indicator, which gauges market price fluctuations.
Key Features:
Moon Phase Markers: The indicator marks the Full Moon and New Moon on the chart using labels. Blue labels are placed below bars for Full Moons, while red labels are placed above bars for New Moons. These markers are based on a manually curated list of moon phase dates for the year 2025.
Volatility Calculation: The indicator calculates market volatility using the ATR (14), which provides a sense of market movement and potential risk. Volatility is plotted as histograms, with blue histograms representing volatility around Full Moons and red histograms around New Moons.
Comparative Analysis: By comparing the volatility around these moon phases to the average volatility, traders can spot potential patterns or heightened market movements. This can inform trading strategies, such as anticipating increased market activity around specific lunar events.
In essence, this tool helps traders identify potential high-volatility periods tied to lunar cycles, which could impact market sentiment and price action.
오픈 소스 스크립트
트레이딩뷰의 진정한 정신에 따라, 이 스크립트의 작성자는 이를 오픈소스로 공개하여 트레이더들이 기능을 검토하고 검증할 수 있도록 했습니다. 작성자에게 찬사를 보냅니다! 이 코드는 무료로 사용할 수 있지만, 코드를 재게시하는 경우 하우스 룰이 적용된다는 점을 기억하세요.
면책사항
해당 정보와 게시물은 금융, 투자, 트레이딩 또는 기타 유형의 조언이나 권장 사항으로 간주되지 않으며, 트레이딩뷰에서 제공하거나 보증하는 것이 아닙니다. 자세한 내용은 이용 약관을 참조하세요.
오픈 소스 스크립트
트레이딩뷰의 진정한 정신에 따라, 이 스크립트의 작성자는 이를 오픈소스로 공개하여 트레이더들이 기능을 검토하고 검증할 수 있도록 했습니다. 작성자에게 찬사를 보냅니다! 이 코드는 무료로 사용할 수 있지만, 코드를 재게시하는 경우 하우스 룰이 적용된다는 점을 기억하세요.
면책사항
해당 정보와 게시물은 금융, 투자, 트레이딩 또는 기타 유형의 조언이나 권장 사항으로 간주되지 않으며, 트레이딩뷰에서 제공하거나 보증하는 것이 아닙니다. 자세한 내용은 이용 약관을 참조하세요.