OPEN-SOURCE SCRIPT
Fundamental Value and Dividend Growth Investing
This script is an original implementation of a Fundamental Value and Dividend Growth Investing Strategy for traders who want to incorporate these concepts in their trading decisions. The script uses technical indicators to determine buy and sell signals based on a set of criteria.
To use the script, traders can input various parameters, such as the length of the simple moving averages (SMA), the rate of change (ROC) length, and the dividend yield. The script calculates the SMA for the long and short periods, the ROC, and the dividend.
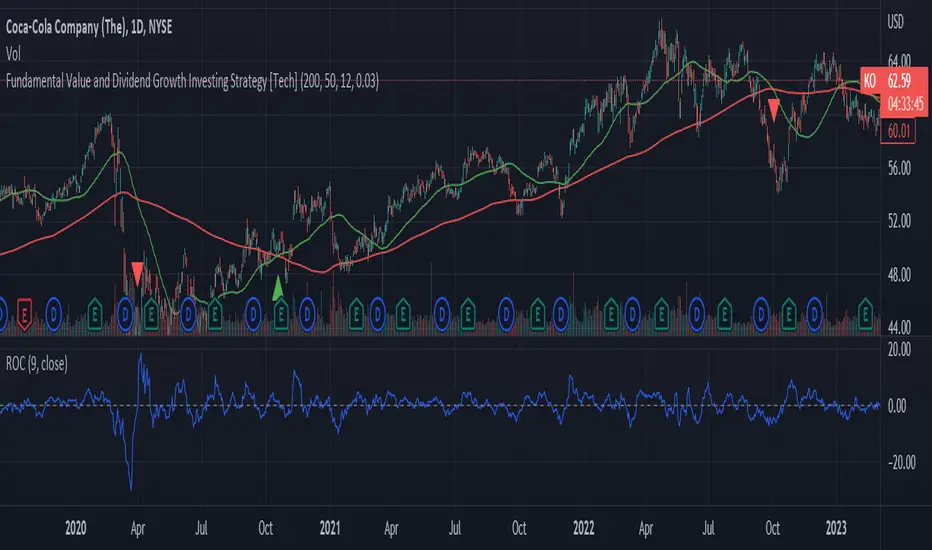
The buy signal is triggered when the current closing price is greater than the short-term SMA, the short-term SMA crosses above the long-term SMA, the ROC is positive, and the closing price is greater than the dividend. The sell signal is triggered when the current closing price is less than the long-term SMA, the long-term SMA crosses above the short-term SMA, and the ROC is negative.
The script plots the signals and the indicators, such as the SMA200, the SMS50, the dividend, and the ROC. The script also includes alert conditions for the buy and sell signals.
The concept underlying the calculations of this script is the Fundamental Value and Dividend Growth Investing Strategy. This strategy aims to identify stocks that are trading below their intrinsic value and have a history of increasing dividends. The SMA and ROC indicators help identify the trends in the stock price, while the dividend yield helps identify stocks with a history of dividend growth.
Overall, this script offers traders an original and useful tool for incorporating Fundamental Value and Dividend Growth Investing Strategy into their trading decisions.
To use the script, traders can input various parameters, such as the length of the simple moving averages (SMA), the rate of change (ROC) length, and the dividend yield. The script calculates the SMA for the long and short periods, the ROC, and the dividend.
The buy signal is triggered when the current closing price is greater than the short-term SMA, the short-term SMA crosses above the long-term SMA, the ROC is positive, and the closing price is greater than the dividend. The sell signal is triggered when the current closing price is less than the long-term SMA, the long-term SMA crosses above the short-term SMA, and the ROC is negative.
The script plots the signals and the indicators, such as the SMA200, the SMS50, the dividend, and the ROC. The script also includes alert conditions for the buy and sell signals.
The concept underlying the calculations of this script is the Fundamental Value and Dividend Growth Investing Strategy. This strategy aims to identify stocks that are trading below their intrinsic value and have a history of increasing dividends. The SMA and ROC indicators help identify the trends in the stock price, while the dividend yield helps identify stocks with a history of dividend growth.
Overall, this script offers traders an original and useful tool for incorporating Fundamental Value and Dividend Growth Investing Strategy into their trading decisions.
오픈 소스 스크립트
트레이딩뷰의 진정한 정신에 따라, 이 스크립트의 작성자는 이를 오픈소스로 공개하여 트레이더들이 기능을 검토하고 검증할 수 있도록 했습니다. 작성자에게 찬사를 보냅니다! 이 코드는 무료로 사용할 수 있지만, 코드를 재게시하는 경우 하우스 룰이 적용된다는 점을 기억하세요.
면책사항
해당 정보와 게시물은 금융, 투자, 트레이딩 또는 기타 유형의 조언이나 권장 사항으로 간주되지 않으며, 트레이딩뷰에서 제공하거나 보증하는 것이 아닙니다. 자세한 내용은 이용 약관을 참조하세요.
오픈 소스 스크립트
트레이딩뷰의 진정한 정신에 따라, 이 스크립트의 작성자는 이를 오픈소스로 공개하여 트레이더들이 기능을 검토하고 검증할 수 있도록 했습니다. 작성자에게 찬사를 보냅니다! 이 코드는 무료로 사용할 수 있지만, 코드를 재게시하는 경우 하우스 룰이 적용된다는 점을 기억하세요.
면책사항
해당 정보와 게시물은 금융, 투자, 트레이딩 또는 기타 유형의 조언이나 권장 사항으로 간주되지 않으며, 트레이딩뷰에서 제공하거나 보증하는 것이 아닙니다. 자세한 내용은 이용 약관을 참조하세요.