PROTECTED SOURCE SCRIPT
업데이트됨 Ichimoku Cloud {Cybernetwork}

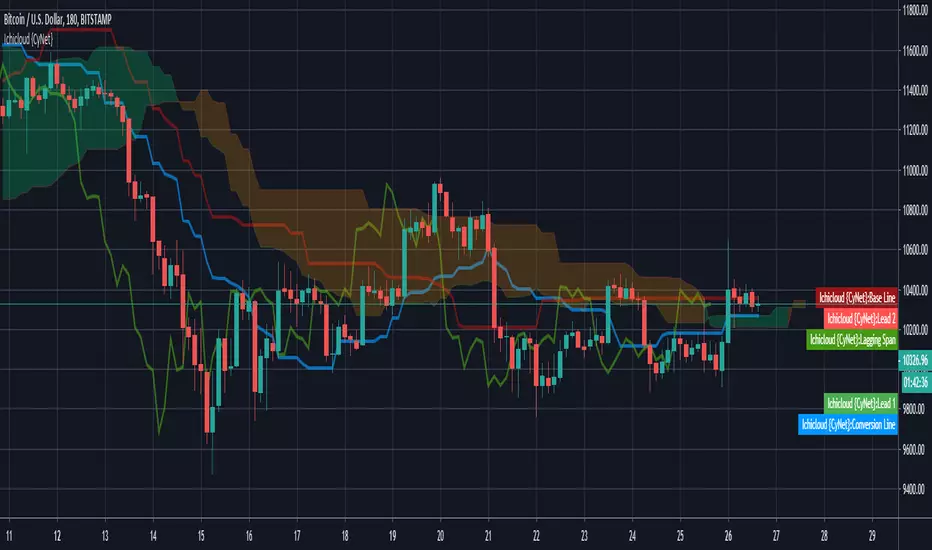
Ichimoku Cloud with parameters optimized for Crypto.
~ * ~ * ~ * ~ * ~ * ~ * ~ * ~ * ~ * ~ * ~ * ~ * ~ * ~ * ~ * ~ * ~ * ~ * ~ * ~ * ~
Taken from: school.stockcharts.com/doku.php?id=technical_indicators:ichimoku_cloud (Aug 2019)
Bullish Signals:
Bearish Signals:
~ * ~ * ~ * ~ * ~ * ~ * ~ * ~ * ~ * ~ * ~ * ~ * ~ * ~ * ~ * ~ * ~ * ~ * ~ * ~ * ~
Please check out my other indicators sets and series, e.g.
Constructive feedback and suggestions are welcome.
~JuniAiko
(=^~^=)v~
~ * ~ * ~ * ~ * ~ * ~ * ~ * ~ * ~ * ~ * ~ * ~ * ~ * ~ * ~ * ~ * ~ * ~ * ~ * ~ * ~
Taken from: school.stockcharts.com/doku.php?id=technical_indicators:ichimoku_cloud (Aug 2019)
Bullish Signals:
- Price moves above cloud (trend)
- Cloud turns from red to green (ebb-flow within trend)
- Price Moves above the Base Line (momentum)
- Conversion Line moves above Base Line (momentum)
Bearish Signals:
- Price moves below cloud (trend)
- Cloud turns from green to red (ebb-flow within trend)
- Price Moves below Base Line (momentum)
- Conversion Line moves below Base Line (momentum)
~ * ~ * ~ * ~ * ~ * ~ * ~ * ~ * ~ * ~ * ~ * ~ * ~ * ~ * ~ * ~ * ~ * ~ * ~ * ~ * ~
Please check out my other indicators sets and series, e.g.
- LIVIDITIUM (dynamic levels),
- AEONDRIFT (standard deviation bands),
- FUSIONGAPS (MA based oscillators),
- MAJESTIC (Momentum/Acceleration/Jerk Oscillators),
- PRISM (PSAR based oscillator, with RSI/StochRSI as well as Momentum/Acceleration/Jerk indicators),
- and more to come.
Constructive feedback and suggestions are welcome.
~JuniAiko
(=^~^=)v~
릴리즈 노트
Tweaked cloud transparency for bright color theme.릴리즈 노트
Added the option to plot only the "cloud" in the settings.보호된 스크립트입니다
이 스크립트는 비공개 소스로 게시됩니다. 하지만 이를 자유롭게 제한 없이 사용할 수 있습니다 – 자세한 내용은 여기에서 확인하세요.
면책사항
해당 정보와 게시물은 금융, 투자, 트레이딩 또는 기타 유형의 조언이나 권장 사항으로 간주되지 않으며, 트레이딩뷰에서 제공하거나 보증하는 것이 아닙니다. 자세한 내용은 이용 약관을 참조하세요.
보호된 스크립트입니다
이 스크립트는 비공개 소스로 게시됩니다. 하지만 이를 자유롭게 제한 없이 사용할 수 있습니다 – 자세한 내용은 여기에서 확인하세요.
면책사항
해당 정보와 게시물은 금융, 투자, 트레이딩 또는 기타 유형의 조언이나 권장 사항으로 간주되지 않으며, 트레이딩뷰에서 제공하거나 보증하는 것이 아닙니다. 자세한 내용은 이용 약관을 참조하세요.