INVITE-ONLY SCRIPT
Waves + ZOOnes TimeFrame
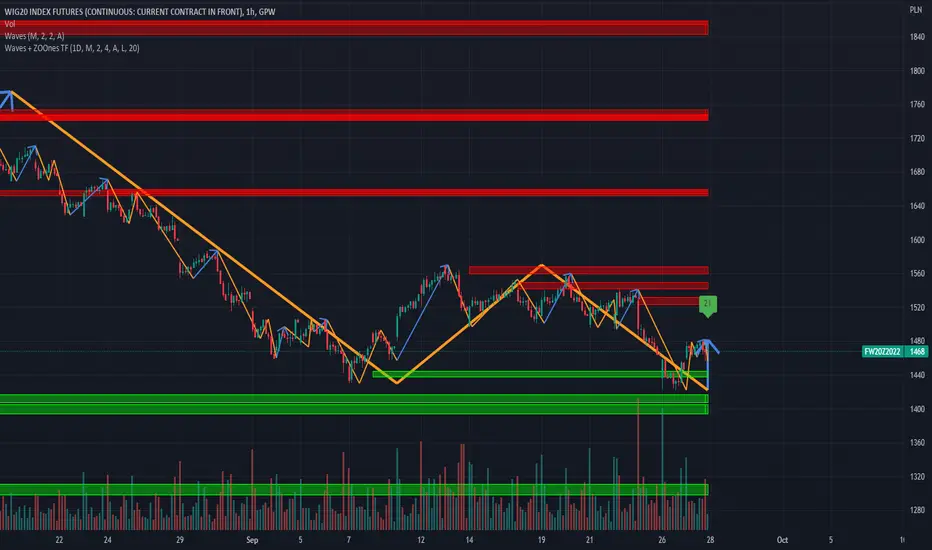
Trend visualization tool in Wave theory. Unlike Elliot waves, it has a constant pattern length. The formation consists of impulse and 3 corrections.
The script analyzes candle relationships in the currect trend, trend will be continueted until candle are not breaking trend rules.
Currently it supports 2 rulesets/wave variants:
Low - More sensitive (trend will change more ofter).
Meddium - Less sensitive ( trend will change less ofter).
Simultaneous observation of both types allows to detect consolidation before the overlapping movement and increase the probability of indicating the moment of the movement occurrence.
Script with limited access, contact author to get authorization
Features:
- Allow to pick timeframe used for visualization.
- Show Low and Middle type/order waves
- Show support/resistance areas for the Low and Middle type/order waves.
- Types for waves and support areas are picked independently. Script can show Middle Waves with Low Waves support areas.
- Shadow mode that show second wave moved to the wave max/min bars.
- Show historical support/resistance areas that are not valid any more.
Script settings:
Timeframe - Time frame used for visualization. It should be less precise or equal as the chart one. e.g. it can show 1D visualization over 1H chart.
TREND VISUALIZATION
Type - Kind of waves should be drawn.
Confirmation - Showing confirmation lavel over current bar If wave direction will not change on this bar
Shadow - Showing second reprezentation of the trend with drawing with the use of minimal and maximal values. It's usefull to determine the delay between the peak and a wave change signal.
Line width - Width of drawn line. Separate setting for Low and Medium trend type.
Color - Color of drawn line. Separate settings for Low and Medium trend type.
Change trend signals - Showing places where alerts are generated (debug feature).
IMPULS VISUALIZATION
Impuls - Picking graphical reprezentation of first bullish arrow.
Color - Color of the first bullish arrow.
Draw arrow - Turning on/off drawing arrow at the end of the impuls wave.
ZOONES
ZOOnes type - Determines what type of trend is used to designate areas of support.
The script analyzes candle relationships in the currect trend, trend will be continueted until candle are not breaking trend rules.
Currently it supports 2 rulesets/wave variants:
Low - More sensitive (trend will change more ofter).
Meddium - Less sensitive ( trend will change less ofter).
Simultaneous observation of both types allows to detect consolidation before the overlapping movement and increase the probability of indicating the moment of the movement occurrence.
Script with limited access, contact author to get authorization
Features:
- Allow to pick timeframe used for visualization.
- Show Low and Middle type/order waves
- Show support/resistance areas for the Low and Middle type/order waves.
- Types for waves and support areas are picked independently. Script can show Middle Waves with Low Waves support areas.
- Shadow mode that show second wave moved to the wave max/min bars.
- Show historical support/resistance areas that are not valid any more.
Script settings:
Timeframe - Time frame used for visualization. It should be less precise or equal as the chart one. e.g. it can show 1D visualization over 1H chart.
TREND VISUALIZATION
Type - Kind of waves should be drawn.
- H(idden) - Do not draw any waves.
- L(low) - Draw low waves
- M(edium) - Draw medium waves
- B(oth) - Draw both low and medium waves
Confirmation - Showing confirmation lavel over current bar If wave direction will not change on this bar
Shadow - Showing second reprezentation of the trend with drawing with the use of minimal and maximal values. It's usefull to determine the delay between the peak and a wave change signal.
Line width - Width of drawn line. Separate setting for Low and Medium trend type.
Color - Color of drawn line. Separate settings for Low and Medium trend type.
Change trend signals - Showing places where alerts are generated (debug feature).
- u - trend change to UP
- d - trend change to DOWN
- U - trand change to UP from the zone
- D - trand change to down from the zone
IMPULS VISUALIZATION
Impuls - Picking graphical reprezentation of first bullish arrow.
- H - Hidden
- F - First
- S - Second
- A - Auto
Color - Color of the first bullish arrow.
Draw arrow - Turning on/off drawing arrow at the end of the impuls wave.
ZOONES
ZOOnes type - Determines what type of trend is used to designate areas of support.
- D - Disabled
- L - Low
- M - Medium
Only nearest zones - Drawing only one nearest zone above and below current price.
Only nearest potencial zones - Drawing only one nearest potencial zone above and below current price.
Resistance - Set of colors (resistance zone background, resistance zone border, potencial resistance zone background, potencial resistance zone border) used for drawing resistance zones and potencial resistance zones.
Support - Set of colors (support zone background, support zone border, potencial support zone background, potencial support zone border) used for drawing support zones and potencial support zones
Show history - Showing zones in historical data
Show fake potencials - Showing historical potencial zonnes that were rejected (debug purpose).
Double count - Treated support and resistance zoones as one zoone
Zone precision - Determines how many bars are included in area calculation.
Alerts:
Low trend DOWN - When Low trend type is changing from UP to DOWN
Low trend UP - When Low trend type is changing from DOWN to UP
middle trend DOWN - When Middle trend type is changing from UP to DOWN
middle trend UP - When Middle trend type is changing from DOWN to UP
middle trend from ZOOnes DOWN - When Middle trend type is changing from UP to DOWN after hiting resistance area .
middle trend from ZOOnes UP = When Middle trend type is changing from DOWN to UP after hiting support area .
Troubleshooting:
In case of any problems, send error details to the author of the script.
초대 전용 스크립트
이 스크립트는 작성자가 승인한 사용자만 접근할 수 있습니다. 사용하려면 요청 후 승인을 받아야 하며, 일반적으로 결제 후에 허가가 부여됩니다. 자세한 내용은 아래 작성자의 안내를 따르거나 Investor_R에게 직접 문의하세요.
트레이딩뷰는 스크립트의 작동 방식을 충분히 이해하고 작성자를 완전히 신뢰하지 않는 이상, 해당 스크립트에 비용을 지불하거나 사용하는 것을 권장하지 않습니다. 커뮤니티 스크립트에서 무료 오픈소스 대안을 찾아보실 수도 있습니다.
작성자 지시 사항
To get access or report problem write on traidingtools@gmail.com
To get access or report problem write on toolkit4trading@proton.me
More details on Website and Youtube.
More details on Website and Youtube.
면책사항
해당 정보와 게시물은 금융, 투자, 트레이딩 또는 기타 유형의 조언이나 권장 사항으로 간주되지 않으며, 트레이딩뷰에서 제공하거나 보증하는 것이 아닙니다. 자세한 내용은 이용 약관을 참조하세요.