INVITE-ONLY SCRIPT
Copter 2.0
💡 The indicator is designed for trading on any timeframe and includes a comprehensive system for determining entry and exit points based on technical analysis, price and volume.
📊 In the new version of Copter 2.0, the take profit and stop loss functions have been added
Let's analyze its key components:
✔️ Trend levels and extremes:
- The indicator determines local highs and lows for a certain period.
- the breakdown of these levels serves as a signal to open positions.
- the High-Low price dynamics analysis method is used to find key entry points.

✔️ Volumes:
-The indicator uses a configurable volume threshold to filter out candles with low volume and display only those with significant volume.
- the algorithm analyzes market data and sets an entry signal (opening a trade) and exit (profit taking/closing a position)

📍 Therefore, whether you are a beginner or an experienced trader, the indicator can help you stay ahead of the game and make more informed trading decisions.
📍 As a result, the trader can be sure that the signal is based on data analysis.
A long or short position can be stopped with either a profit or a small loss without prejudice to the potential profit.
✔️ Signal filtering:
- volume and volatile indicators are used to confirm the trend
- if a volume or volatility filter does not confirm the breakdown, the input signal is ignored
- analysis of moving averages of volumes and ATR is used

✔️ The use of the RSI in overbought and oversold analysis:
- the RSI indicator analyzes the strength of the current trend
- if the RSI exceeds 70, exit from a long position is possible
- if the RSI falls below 30, exit from a short position is possible

✔️ The use of EMA 20 and EMA 200
is additional moving average data that determines the current trend and the trend on higher timeframes.
- the main idea is that when they cross, we can see a change in trend movement and determine the general mood at the moment, based on which signals appear to open/close a deal.
- also, the indicator analyzes the past movement, thus determining the future direction
- based on the opening and closing of the past days, weeks, months.

✔️ Stop loss and risk management
- when entering a trade, a dynamic stop loss is set based on the percentage price change
- exit the position is carried out when a stop loss or a signal from the RSI is reached.
- it helps to minimize losses and protect profits
The market is unstable, and it is impossible to know what awaits it in the future.
The only way to manage risk is to limit the loss by setting a stop loss at 1% - 2% of the entry point.
It is recommended to set the profit in the ratio 1:1, 1:2,1:3, with partial fixation of 40%, 30%, 30% or wait for the indicator signal (TP)
We recommend fixing positions in parts. There will be a signal in the opposite direction when the volume is released.

To match the risk of the transaction, we recommend that you do not enter with high leverage.
Trade only with the amount that you are willing to lose.
With increased volatility in the market and flat, the indicator can give many signals.
After a strong fall or growth, we recommend not to open positions, because the probability of a flat is high.
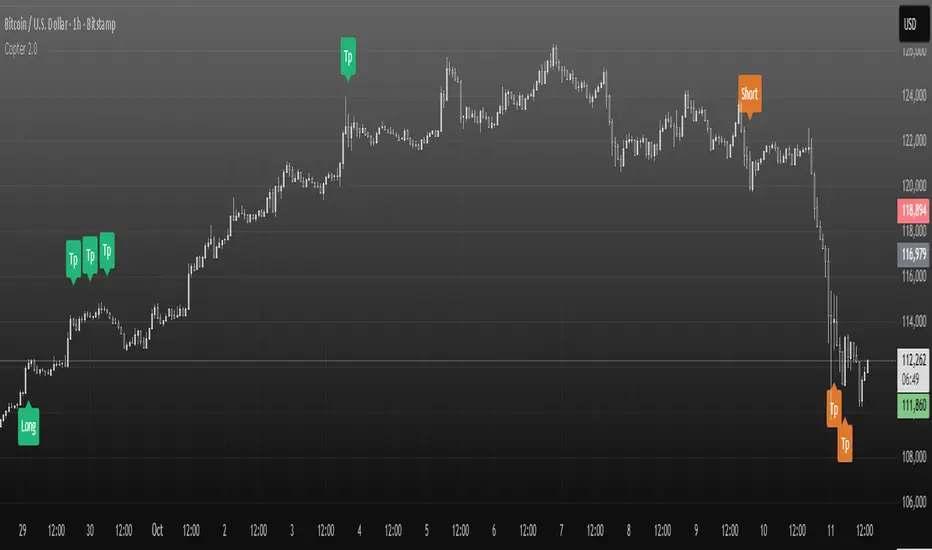
✔️ Visualization of entry and exit points
- Entry points (long and short) are graphically displayed. green - long, orange - short
- stop loss levels are marked for clarity of risk management
✔️Recommendations for working with the indicator!
Entry/exit is performed on the next candle after the candle with the signal (buy/sell)
All timeframes and any trading pairs are used (when selecting settings for each one)
The indicator combines several methods of technical analysis:
- work with support and resistance levels
- filtering of signals based on volumes and volatility
- Overbought and oversold analysis using the RSI
- automatic risk management through stop loss
This approach makes the indicator a useful tool for short-term trading and active scalping.
❗️ NO REPAINT ! ❗️
📊 In the new version of Copter 2.0, the take profit and stop loss functions have been added
Let's analyze its key components:
✔️ Trend levels and extremes:
- The indicator determines local highs and lows for a certain period.
- the breakdown of these levels serves as a signal to open positions.
- the High-Low price dynamics analysis method is used to find key entry points.
✔️ Volumes:
-The indicator uses a configurable volume threshold to filter out candles with low volume and display only those with significant volume.
- the algorithm analyzes market data and sets an entry signal (opening a trade) and exit (profit taking/closing a position)
📍 Therefore, whether you are a beginner or an experienced trader, the indicator can help you stay ahead of the game and make more informed trading decisions.
📍 As a result, the trader can be sure that the signal is based on data analysis.
A long or short position can be stopped with either a profit or a small loss without prejudice to the potential profit.
✔️ Signal filtering:
- volume and volatile indicators are used to confirm the trend
- if a volume or volatility filter does not confirm the breakdown, the input signal is ignored
- analysis of moving averages of volumes and ATR is used
✔️ The use of the RSI in overbought and oversold analysis:
- the RSI indicator analyzes the strength of the current trend
- if the RSI exceeds 70, exit from a long position is possible
- if the RSI falls below 30, exit from a short position is possible
✔️ The use of EMA 20 and EMA 200
is additional moving average data that determines the current trend and the trend on higher timeframes.
- the main idea is that when they cross, we can see a change in trend movement and determine the general mood at the moment, based on which signals appear to open/close a deal.
- also, the indicator analyzes the past movement, thus determining the future direction
- based on the opening and closing of the past days, weeks, months.
✔️ Stop loss and risk management
- when entering a trade, a dynamic stop loss is set based on the percentage price change
- exit the position is carried out when a stop loss or a signal from the RSI is reached.
- it helps to minimize losses and protect profits
The market is unstable, and it is impossible to know what awaits it in the future.
The only way to manage risk is to limit the loss by setting a stop loss at 1% - 2% of the entry point.
It is recommended to set the profit in the ratio 1:1, 1:2,1:3, with partial fixation of 40%, 30%, 30% or wait for the indicator signal (TP)
We recommend fixing positions in parts. There will be a signal in the opposite direction when the volume is released.
To match the risk of the transaction, we recommend that you do not enter with high leverage.
Trade only with the amount that you are willing to lose.
With increased volatility in the market and flat, the indicator can give many signals.
After a strong fall or growth, we recommend not to open positions, because the probability of a flat is high.
✔️ Visualization of entry and exit points
- Entry points (long and short) are graphically displayed. green - long, orange - short
- stop loss levels are marked for clarity of risk management
✔️Recommendations for working with the indicator!
Entry/exit is performed on the next candle after the candle with the signal (buy/sell)
All timeframes and any trading pairs are used (when selecting settings for each one)
The indicator combines several methods of technical analysis:
- work with support and resistance levels
- filtering of signals based on volumes and volatility
- Overbought and oversold analysis using the RSI
- automatic risk management through stop loss
This approach makes the indicator a useful tool for short-term trading and active scalping.
❗️ NO REPAINT ! ❗️
초대 전용 스크립트
이 스크립트는 작성자가 승인한 사용자만 접근할 수 있습니다. 사용하려면 요청 후 승인을 받아야 하며, 일반적으로 결제 후에 허가가 부여됩니다. 자세한 내용은 아래 작성자의 안내를 따르거나 mari_trade에게 직접 문의하세요.
트레이딩뷰는 스크립트의 작동 방식을 충분히 이해하고 작성자를 완전히 신뢰하지 않는 이상, 해당 스크립트에 비용을 지불하거나 사용하는 것을 권장하지 않습니다. 커뮤니티 스크립트에서 무료 오픈소스 대안을 찾아보실 수도 있습니다.
작성자 지시 사항
to use this indicator, please contact PM
면책사항
해당 정보와 게시물은 금융, 투자, 트레이딩 또는 기타 유형의 조언이나 권장 사항으로 간주되지 않으며, 트레이딩뷰에서 제공하거나 보증하는 것이 아닙니다. 자세한 내용은 이용 약관을 참조하세요.