OPEN-SOURCE SCRIPT
업데이트됨 XAU 0/5 Grid
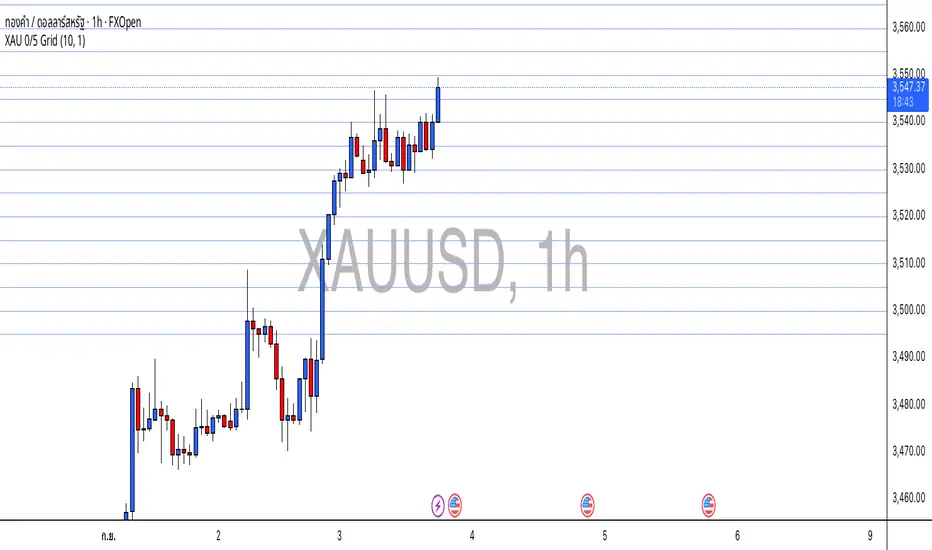
This indicator draws horizontal price grids for XAUUSD. It anchors the grid to a base price that ends with 0 or 5, then plots equally spaced levels every 5 price units above and below that base. It’s a clean way to eyeball fixed-interval structure for rough support/resistance zones and simple TP/SL planning.
How it works
Base (0/5):
base = floor(close / 5) × 5 → forces the base to always end with 0/5.
Grid levels:
level_i = base + i × 5, where i is any integer (positive/negative).
The script updates positions only when the base changes to avoid flicker and reduce chart load.
It uses a persistent line array to manage the line objects efficiently.
Usage
Add the indicator to an XAUUSD chart on any timeframe.
Configure in the panel:
Show Lines – toggle visibility
Lines each side – number of lines above/below the base
Line Color / Line Width – appearance
Use the grid as fixed reference levels (e.g., 3490, 3495, 3500, 3505, …) for planning TP/SL or observing grid breaks.
Highlights
Strict 0/5 anchoring keeps levels evenly spaced and easy to read on gold.
Auto-reanchors when price moves to a new 0/5 zone, maintaining a steady view.
Lightweight design: lines are created once and then updated, minimizing overhead.
Limitations
Visualization only — not a buy/sell signal.
Spacing is fixed at 5 price units, optimized for XAUUSD. If used on other symbols/brokers with different tick scales, adjust the logic accordingly.
Grid lines do not guarantee support/resistance; always combine with broader market context.
릴리즈 노트
fix bug릴리즈 노트
fix bug오픈 소스 스크립트
트레이딩뷰의 진정한 정신에 따라, 이 스크립트의 작성자는 이를 오픈소스로 공개하여 트레이더들이 기능을 검토하고 검증할 수 있도록 했습니다. 작성자에게 찬사를 보냅니다! 이 코드는 무료로 사용할 수 있지만, 코드를 재게시하는 경우 하우스 룰이 적용된다는 점을 기억하세요.
면책사항
해당 정보와 게시물은 금융, 투자, 트레이딩 또는 기타 유형의 조언이나 권장 사항으로 간주되지 않으며, 트레이딩뷰에서 제공하거나 보증하는 것이 아닙니다. 자세한 내용은 이용 약관을 참조하세요.
오픈 소스 스크립트
트레이딩뷰의 진정한 정신에 따라, 이 스크립트의 작성자는 이를 오픈소스로 공개하여 트레이더들이 기능을 검토하고 검증할 수 있도록 했습니다. 작성자에게 찬사를 보냅니다! 이 코드는 무료로 사용할 수 있지만, 코드를 재게시하는 경우 하우스 룰이 적용된다는 점을 기억하세요.
면책사항
해당 정보와 게시물은 금융, 투자, 트레이딩 또는 기타 유형의 조언이나 권장 사항으로 간주되지 않으며, 트레이딩뷰에서 제공하거나 보증하는 것이 아닙니다. 자세한 내용은 이용 약관을 참조하세요.