OPEN-SOURCE SCRIPT
Previous 5 Days OHLC + Dates + Prices
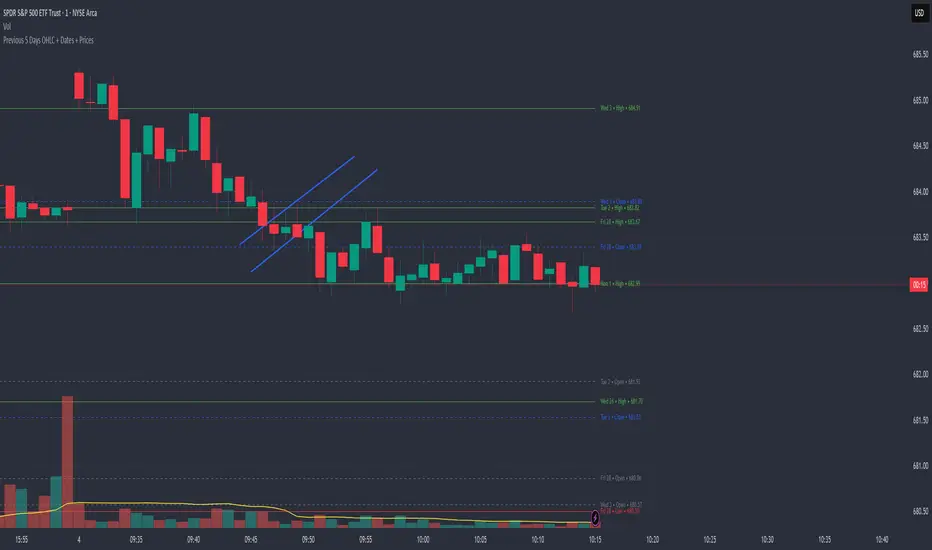
Title: Previous 5 Days OHLC Levels (Extended Lines + Labels)
Description:
This indicator automatically plots the Open, High, Low, and Close (OHLC) levels for the previous 5 trading days. Unlike standard daily separators, this tool extends the lines from their historical origin all the way to the current price bar, allowing traders to instantly see how current price action interacts with recent support and resistance levels.
Key Features:
5-Day Lookback: Automatically fetches and plots OHLC data for the last 5 trading sessions.
Extended Lines: Lines extend to the current bar (Right) to visualize immediate Support/Resistance zones.
Smart Labels: Each line is marked with the Day Name, Date, Type (O/H/L/C), and the Exact Price.
Customizable Positioning: Choose to display labels on the Left (start of the day) or the Right (next to current price) to keep your chart clean.
Toggle Visibility: Individually turn on/off Opens, Closes, Highs, or Lows to focus on the data that matters to your strategy.
How to Use:
Trend Analysis: Use previous Highs and Lows to identify potential breakout or breakdown levels.
Range Trading: Identify where price previously opened or closed to find intraday pivots.
Clean Charting: Use the settings to hide labels or specific lines (e.g., hide Opens/Closes to see only the Daily Range).
Settings:
Label Position: Switch between "Left" (historical origin) and "Right" (current price).
Visibility: Checkboxes to show/hide Open, High, Low, Close, and Text Labels.
Style: Fully customizable colors for each level type.
Technical Note: This script is optimized for performance (Pine Script v6). It uses array management and executes drawing logic only on the last bar to minimize resource usage while maintaining real-time accuracy.
오픈 소스 스크립트
트레이딩뷰의 진정한 정신에 따라, 이 스크립트의 작성자는 이를 오픈소스로 공개하여 트레이더들이 기능을 검토하고 검증할 수 있도록 했습니다. 작성자에게 찬사를 보냅니다! 이 코드는 무료로 사용할 수 있지만, 코드를 재게시하는 경우 하우스 룰이 적용된다는 점을 기억하세요.
면책사항
해당 정보와 게시물은 금융, 투자, 트레이딩 또는 기타 유형의 조언이나 권장 사항으로 간주되지 않으며, 트레이딩뷰에서 제공하거나 보증하는 것이 아닙니다. 자세한 내용은 이용 약관을 참조하세요.
오픈 소스 스크립트
트레이딩뷰의 진정한 정신에 따라, 이 스크립트의 작성자는 이를 오픈소스로 공개하여 트레이더들이 기능을 검토하고 검증할 수 있도록 했습니다. 작성자에게 찬사를 보냅니다! 이 코드는 무료로 사용할 수 있지만, 코드를 재게시하는 경우 하우스 룰이 적용된다는 점을 기억하세요.
면책사항
해당 정보와 게시물은 금융, 투자, 트레이딩 또는 기타 유형의 조언이나 권장 사항으로 간주되지 않으며, 트레이딩뷰에서 제공하거나 보증하는 것이 아닙니다. 자세한 내용은 이용 약관을 참조하세요.