PROTECTED SOURCE SCRIPT
ATR & Price Z-Score
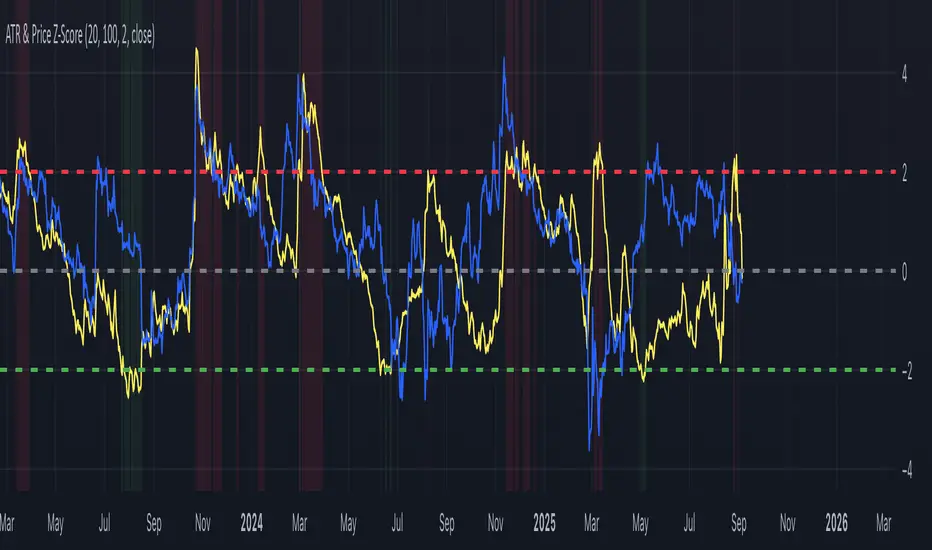
This indicator combines the ATR Z-Score and the Price Z-Score into a single framework for evaluating market conditions using statistical context. The ATR Z-Score standardizes volatility by comparing the current ATR value to its historical mean and standard deviation, allowing traders to see when volatility is unusually high (above +2) or unusually low (below –2). The Price Z-Score applies the same normalization process to price itself, showing how far the current close is from its moving average in standard deviation terms, which highlights statistically stretched conditions that often align with overbought or oversold states. By plotting both measures together, traders can identify when price moves are supported by volatility or when the two diverge. For example, a high Price Z paired with a high ATR Z can confirm the strength of a breakout, while a high Price Z with a low ATR Z may suggest an unsustainable move lacking volatility support. Conversely, a volatility spike without an extreme in price can point to shakeouts or regime shifts. Because both measures are normalized, they can be compared across different markets and timeframes, making the indicator useful for spotting breakouts, squeezes, reversals, and abnormal conditions in a statistically consistent way.
보호된 스크립트입니다
이 스크립트는 비공개 소스로 게시됩니다. 하지만 이를 자유롭게 제한 없이 사용할 수 있습니다 – 자세한 내용은 여기에서 확인하세요.
면책사항
해당 정보와 게시물은 금융, 투자, 트레이딩 또는 기타 유형의 조언이나 권장 사항으로 간주되지 않으며, 트레이딩뷰에서 제공하거나 보증하는 것이 아닙니다. 자세한 내용은 이용 약관을 참조하세요.
보호된 스크립트입니다
이 스크립트는 비공개 소스로 게시됩니다. 하지만 이를 자유롭게 제한 없이 사용할 수 있습니다 – 자세한 내용은 여기에서 확인하세요.
면책사항
해당 정보와 게시물은 금융, 투자, 트레이딩 또는 기타 유형의 조언이나 권장 사항으로 간주되지 않으며, 트레이딩뷰에서 제공하거나 보증하는 것이 아닙니다. 자세한 내용은 이용 약관을 참조하세요.