OPEN-SOURCE SCRIPT
업데이트됨 [Kpt-Ahab] PnL-calculator
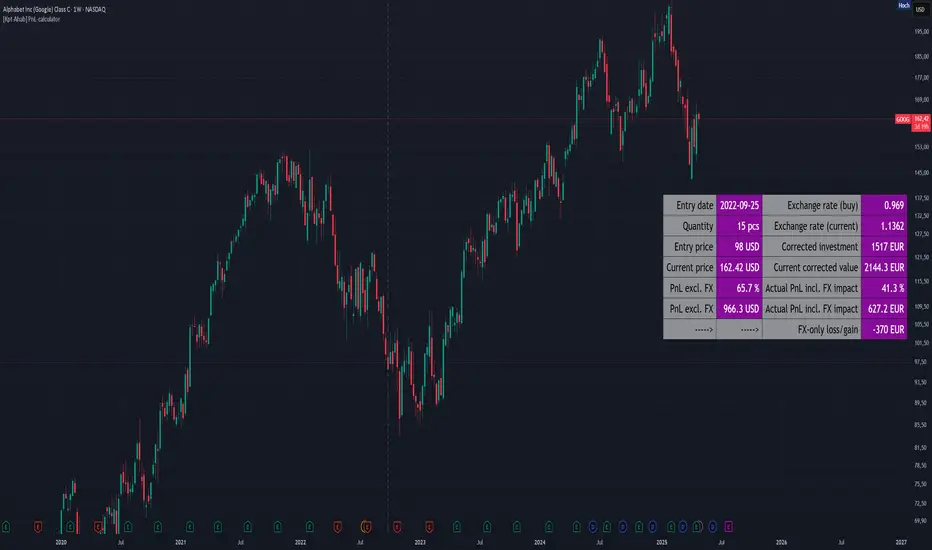
The PnL-Cal shows how much you’re up or down in your own currency, based on the current exchange rate.
Let’s say your home currency is EUR.
On October 10, 2022, you bought 10 Tesla stocks at $219 apiece.
Back then, with an exchange rate of 0.9701, you spent €2,257.40.
If you sold the 10 Tesla shares on April 17, 2025 for $241.37 each, that’s around a 10% gain in USD.
But if you converted the USD back to EUR on the same day at an exchange rate of 1.1398, you’d actually end up with an overall loss of about 6.2%.
Right now, only a single entry point is supported.
If you bought shares on different days with different exchange rates, you’ll unfortunately have to enter an average for now.
For viewing on a phone, the table can be simplified.
릴리즈 노트
Small fixes and more user-friendly table headings.릴리즈 노트
Improved color contrast릴리즈 노트
Display corrections릴리즈 노트
FX-only gain/loss formulas updated — now factoring in more than just FX rates.릴리즈 노트
Description and FunctionalityThe script combines price and currency changes to calculate the actual performance of an investment, including the effect of exchange rate fluctuations.
1. User Inputs
Purchase date, purchase price, and quantity are defined via input fields.
Input of the base currency (e.g., CHF, EUR) and the data provider (e.g., FX_IDC).
Selection of a color scheme for the lines and tables displayed in the chart.
2. Exchange Rate Calculation
The script loads the current exchange rate (syminfo.currency → base currency).
The exchange rate at the time of purchase is stored.
This enables the calculation of the impact of currency fluctuations on the investment performance later on.
3. Chart Displays
Vertical line: Marks the purchase date on the chart.
Horizontal line: Marks the purchase price.
4. Performance Calculation
The script calculates:
Price change (absolute and percentage) without currency effects.
Initial investment (adjusted for the exchange rate at the time of purchase).
Current value (based on the current exchange rate).
Overall performance including exchange rate effects.
Isolated impact of exchange rate changes on performance.
5. Table Display
A dynamic table is shown on the chart.
The display can be either:
Full table (desktop view, detailed information)
Compact table (mobile/small view)
Term Explanation
PnL excl. FX Profit/Loss from price movement only (excluding FX).
PnL incl. FX Actual profit/loss including exchange rate impact.
FX only Portion of the profit/loss caused solely by exchange rate changes.
Corrected invest Adjusted purchase and current value in the base currency.
오픈 소스 스크립트
트레이딩뷰의 진정한 정신에 따라, 이 스크립트의 작성자는 이를 오픈소스로 공개하여 트레이더들이 기능을 검토하고 검증할 수 있도록 했습니다. 작성자에게 찬사를 보냅니다! 이 코드는 무료로 사용할 수 있지만, 코드를 재게시하는 경우 하우스 룰이 적용된다는 점을 기억하세요.
면책사항
해당 정보와 게시물은 금융, 투자, 트레이딩 또는 기타 유형의 조언이나 권장 사항으로 간주되지 않으며, 트레이딩뷰에서 제공하거나 보증하는 것이 아닙니다. 자세한 내용은 이용 약관을 참조하세요.
오픈 소스 스크립트
트레이딩뷰의 진정한 정신에 따라, 이 스크립트의 작성자는 이를 오픈소스로 공개하여 트레이더들이 기능을 검토하고 검증할 수 있도록 했습니다. 작성자에게 찬사를 보냅니다! 이 코드는 무료로 사용할 수 있지만, 코드를 재게시하는 경우 하우스 룰이 적용된다는 점을 기억하세요.
면책사항
해당 정보와 게시물은 금융, 투자, 트레이딩 또는 기타 유형의 조언이나 권장 사항으로 간주되지 않으며, 트레이딩뷰에서 제공하거나 보증하는 것이 아닙니다. 자세한 내용은 이용 약관을 참조하세요.