INVITE-ONLY SCRIPT
업데이트됨 Jackrabbit.modulus.RangeHunter

Range Hunter is a unique module that offers a wide range of trading potentials and paradigms for the Jackrabbit suite.
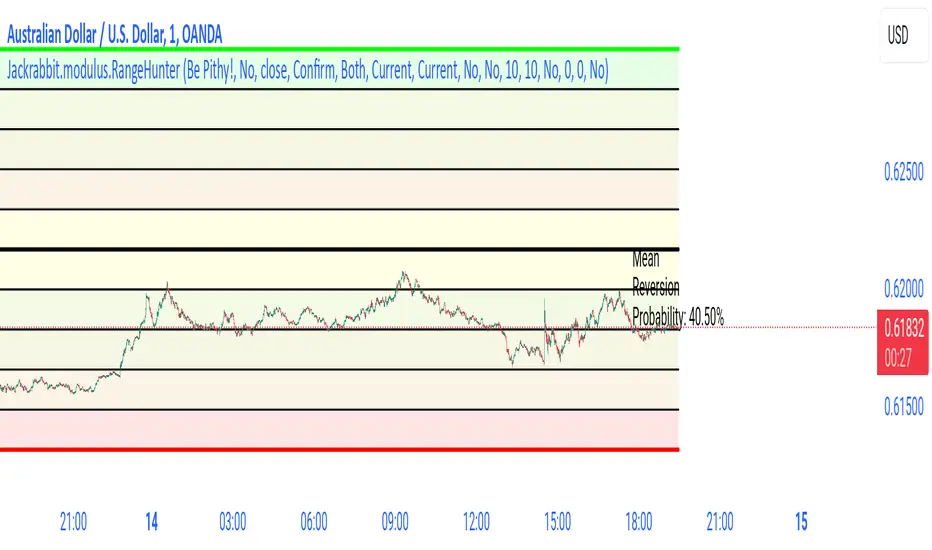
Range Hunter works by finding the highest boundary and the lowest boundary of a time frame. From there, it creates a median by which the market should fluctuate as signs of its health. When the price stays in the upper/lower ranges for too long, the market is considered "unhealthy". Price action should cycle around the median routinele for a healthy market.
From the upper range to the lower range is divided into 10% segments.
There are five segments above the median where price action is considered over valued or oversold.
There are five segments below the median where price action is considered undervalued or oversold.
Buying and selling is divided into 10 boundaries. The 10th boundary for purchasing starts at the lowest range and goes downwards as price climbs. The 10th boundary for selling is where the price is the highest range and goes downwards as price drops.
Buys take place when price action drops bwelow and the climbs above the desire boundary. Sells behave the exact opposite.
The user can configure the boundary that buying and selling takes place independently and supports all elements/settings of the Jackrabbit modulus framework except confirmation bias. If confirmation bias is desired then this module needs to be loaded twice.
The Jackrabbit modulus framework is a plug in play paradigm built to operate through TradingView's indicator on indicatior (IoI) functionality. As such, this script receives a signal line from the previous script in the IoI chain, and evaluates the buy/sell signals appropriate to the current analysis.
릴리즈 노트
Added ability to ignore all time high/low on chart. 릴리즈 노트
Added mean reversion probability.Mean reversion probability is a measure that captures how likely it is for a price to return to its average level after moving away from it. Think of it like a rubber band—when stretched too far, it tends to snap back to its original position. This statistic helps indicate whether a price is likely to "revert to the norm" or continue to drift further away, giving a sense of balance or tension in the market.
초대 전용 스크립트
이 스크립트는 작성자가 승인한 사용자만 접근할 수 있습니다. 사용하려면 요청 후 승인을 받아야 하며, 일반적으로 결제 후에 허가가 부여됩니다. 자세한 내용은 아래 작성자의 안내를 따르거나 RobertD7723에게 직접 문의하세요.
트레이딩뷰는 스크립트의 작동 방식을 충분히 이해하고 작성자를 완전히 신뢰하지 않는 이상, 해당 스크립트에 비용을 지불하거나 사용하는 것을 권장하지 않습니다. 커뮤니티 스크립트에서 무료 오픈소스 대안을 찾아보실 수도 있습니다.
작성자 지시 사항
This script is by invitation only. To learn more about accessing this script, please see my signature or send me a PM. Thank you.
Join my Patreon for exclusive access to Jackrabbit TV,
patreon.com/RD3277
patreon.com/RD3277
면책사항
해당 정보와 게시물은 금융, 투자, 트레이딩 또는 기타 유형의 조언이나 권장 사항으로 간주되지 않으며, 트레이딩뷰에서 제공하거나 보증하는 것이 아닙니다. 자세한 내용은 이용 약관을 참조하세요.