OPEN-SOURCE SCRIPT
QM Signal [TradingFinder] Quasimodo Pattern - Head and Shoulders
🔵 Introduction
One of the patterns in "RTM" is the "QM" pattern, also known as "Quasimodo". Its name is derived from the appearance of "Hunchback of Notre-Dame" from Victor Hugo's novel. It is a type of "Head and Shoulders" pattern.
🔵 Formation Method
🟣 Upward Trend
In an upward trend, the left shoulder is formed, and the price creates a new peak higher than the left shoulder peak [HEAD]. After a decline, it manages to break the previous low [CHOCH] and move upward again. We expect the price to return approximately between [HEAD] and [Left Shoulder] to form the "QM" pattern.

🟣 Downward Trend
In a downward trend, with a price decline, a new valley is created, forming the left shoulder, and the price forms a new valley lower than the left shoulder valley [HEAD]. After a price increase, it manages to break the previous high [CHOCH] and move downward again. We expect the price to return approximately between [HEAD] and [Left Shoulder] to form the "Quasimodo" pattern.

Note: The "QM" pattern is a specific type of head and shoulders pattern in which in the first move, the previous support is broken and it's the best condition for price reversal.
🔵 Entry Conditions for "Buy" and "Sell"
🟢 Buy
Buy Position: When a complete "QM" pattern is formed in a downtrend; we expect the price to reach the left shoulder area (with confirmation) during the retracement to enter the "BUY" position.
Profit Target in Buy Scenario: Expecting a move to the peak that broke it and the highest point in the current "Swing".
Stop Loss: Below the "Head," which is the lowest point.

🔴 Sell
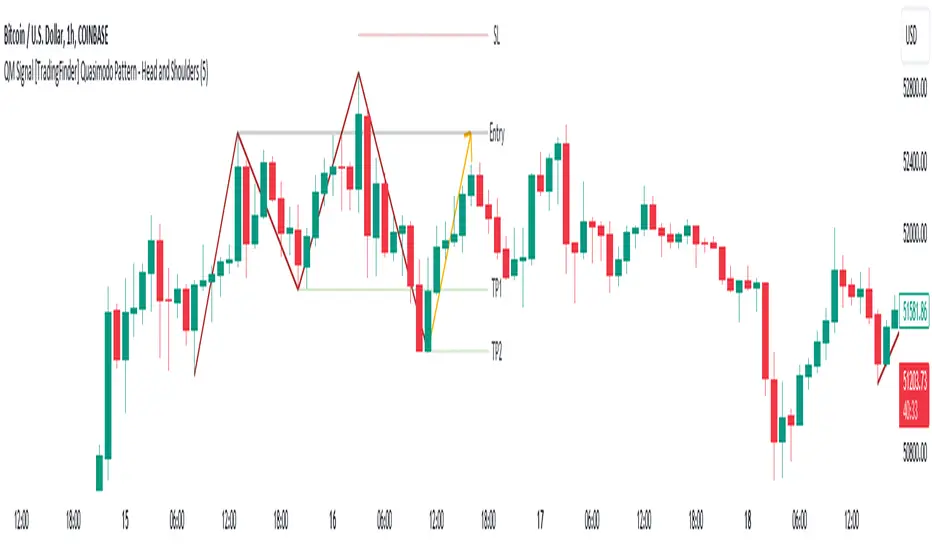
Sell Position: When a "QM" pattern is formed in an uptrend, we look for entry into the "Sell" position as the price retraces to the left shoulder area.
Profit Target in Sell Scenario: Expecting a move to the price floor that has been broken [TP1] and the entire "Swing" or [TP2].
Take Profit: Above the highest point or above the [Head] area will be the "SL" region.

Note: Certainly, no method alone guarantees trading capability and requires different confirmations. This indicator only detects the "QM" pattern, and the rest of the analysis will be the responsibility of the user.
Note: These profit and loss limits are based on market movements [Market Structure] and will be provided as approximate and supportive.
One of the patterns in "RTM" is the "QM" pattern, also known as "Quasimodo". Its name is derived from the appearance of "Hunchback of Notre-Dame" from Victor Hugo's novel. It is a type of "Head and Shoulders" pattern.
🔵 Formation Method
🟣 Upward Trend
In an upward trend, the left shoulder is formed, and the price creates a new peak higher than the left shoulder peak [HEAD]. After a decline, it manages to break the previous low [CHOCH] and move upward again. We expect the price to return approximately between [HEAD] and [Left Shoulder] to form the "QM" pattern.
🟣 Downward Trend
In a downward trend, with a price decline, a new valley is created, forming the left shoulder, and the price forms a new valley lower than the left shoulder valley [HEAD]. After a price increase, it manages to break the previous high [CHOCH] and move downward again. We expect the price to return approximately between [HEAD] and [Left Shoulder] to form the "Quasimodo" pattern.
Note: The "QM" pattern is a specific type of head and shoulders pattern in which in the first move, the previous support is broken and it's the best condition for price reversal.
🔵 Entry Conditions for "Buy" and "Sell"
🟢 Buy
Buy Position: When a complete "QM" pattern is formed in a downtrend; we expect the price to reach the left shoulder area (with confirmation) during the retracement to enter the "BUY" position.
Profit Target in Buy Scenario: Expecting a move to the peak that broke it and the highest point in the current "Swing".
Stop Loss: Below the "Head," which is the lowest point.
🔴 Sell
Sell Position: When a "QM" pattern is formed in an uptrend, we look for entry into the "Sell" position as the price retraces to the left shoulder area.
Profit Target in Sell Scenario: Expecting a move to the price floor that has been broken [TP1] and the entire "Swing" or [TP2].
Take Profit: Above the highest point or above the [Head] area will be the "SL" region.
Note: Certainly, no method alone guarantees trading capability and requires different confirmations. This indicator only detects the "QM" pattern, and the rest of the analysis will be the responsibility of the user.
Note: These profit and loss limits are based on market movements [Market Structure] and will be provided as approximate and supportive.
오픈 소스 스크립트
트레이딩뷰의 진정한 정신에 따라, 이 스크립트의 작성자는 이를 오픈소스로 공개하여 트레이더들이 기능을 검토하고 검증할 수 있도록 했습니다. 작성자에게 찬사를 보냅니다! 이 코드는 무료로 사용할 수 있지만, 코드를 재게시하는 경우 하우스 룰이 적용된다는 점을 기억하세요.
💎Get instant (Demo/Vip) access here: tradingFinder.com/
✅Get access to our support team: t.me/TFLABS
🧠Free Forex, Crypto & Stock Trading tutorial, same as ICT, Smart Money & Price Action:
tradingfinder.com/education/forex/
✅Get access to our support team: t.me/TFLABS
🧠Free Forex, Crypto & Stock Trading tutorial, same as ICT, Smart Money & Price Action:
tradingfinder.com/education/forex/
면책사항
해당 정보와 게시물은 금융, 투자, 트레이딩 또는 기타 유형의 조언이나 권장 사항으로 간주되지 않으며, 트레이딩뷰에서 제공하거나 보증하는 것이 아닙니다. 자세한 내용은 이용 약관을 참조하세요.