PINE LIBRARY
업데이트됨 fibpoint
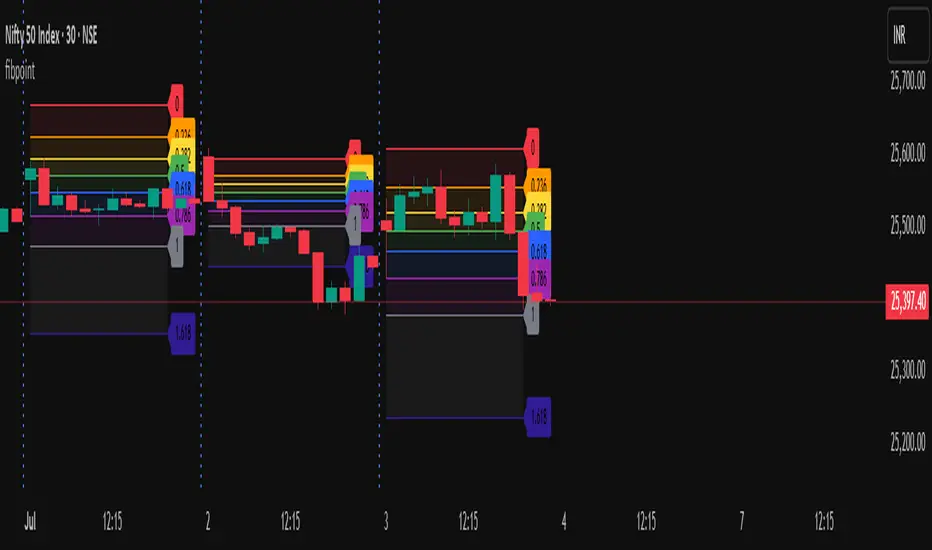
Library "fibpoint"
A library for generating Fibonacci retracement levels on a chart, including customizable lines, labels, and filled areas between levels. It provides functionality to plot Fibonacci levels based on given price points and bar indices, with options for custom levels and colors.
getFib(startPoint, endPoint, startIdx, endIdx, fibLevels, fibColors, tsp)
Calculates Fibonacci retracement levels between two price points and draws corresponding lines and labels on the chart.
Parameters:
startPoint (float): The starting price point for the Fibonacci retracement.
endPoint (float): The ending price point for the Fibonacci retracement.
startIdx (int): The bar index where the Fibonacci retracement starts.
endIdx (int): The bar index where the Fibonacci retracement ends.
fibLevels (array<float>): An optional array of custom Fibonacci levels (default is [0.0, 0.236, 0.382, 0.5, 0.618, 0.786, 1.0, 1.618]).
fibColors (array<color>): An optional array of colors for each Fibonacci level (default is a predefined color array).
tsp (int): The transparency level for the fill between Fibonacci levels (default is 90).
Returns: A tuple containing an array of fibItem objects (each with a line and label) and an array of linefill objects for the filled areas between levels.
fibItem
A custom type representing a Fibonacci level with its associated line and label.
Fields:
line (series line): The line object drawn for the Fibonacci level.
label (series label): The label object displaying the Fibonacci level value.
릴리즈 노트
v2Normalized Price Points: Version 2 introduces direction ("up" or "down") and normalizes start (sp) and end (ep) prices using math.min/max, ensuring consistent Fibonacci price calculations without reversing level or color arrays:
파인 라이브러리
트레이딩뷰의 진정한 정신에 따라, 작성자는 이 파인 코드를 오픈소스 라이브러리로 게시하여 커뮤니티의 다른 파인 프로그래머들이 재사용할 수 있도록 했습니다. 작성자에게 경의를 표합니다! 이 라이브러리는 개인적으로 사용하거나 다른 오픈소스 게시물에서 사용할 수 있지만, 이 코드의 게시물 내 재사용은 하우스 룰에 따라 규제됩니다.
면책사항
해당 정보와 게시물은 금융, 투자, 트레이딩 또는 기타 유형의 조언이나 권장 사항으로 간주되지 않으며, 트레이딩뷰에서 제공하거나 보증하는 것이 아닙니다. 자세한 내용은 이용 약관을 참조하세요.