OPEN-SOURCE SCRIPT
업데이트됨 GeoMean+
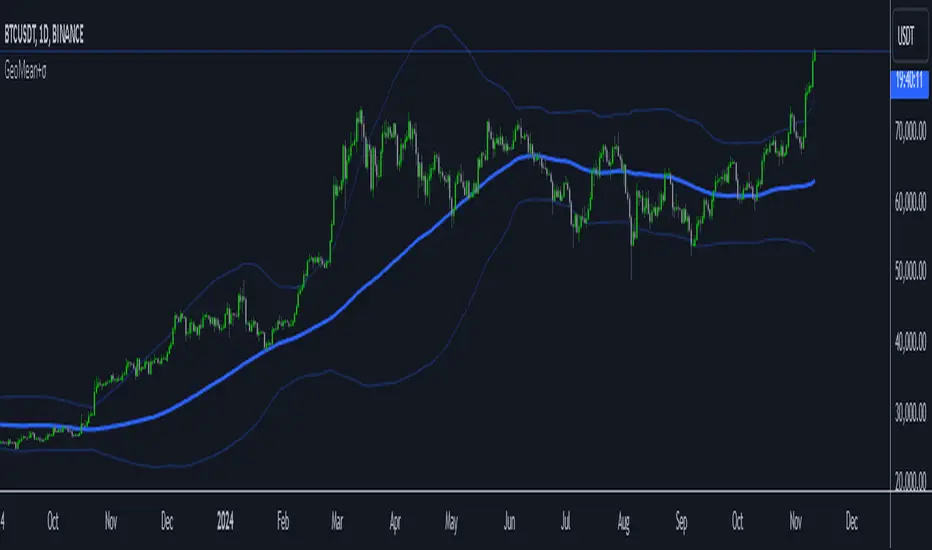
The Geometric Moving Average (GMA) with Sigma Bands is a technical indicator that combines trend following and volatility measurement. The blue center line represents the GMA, while the upper and lower bands (light blue) show price volatility using standard deviations (sigma). Traders can use this indicator for both trend following and mean reversion strategies. For trend following, enter long when price crosses above the GMA and short when it crosses below, using the bands as profit targets. For mean reversion, look for buying opportunities when price touches the lower band and selling opportunities at the upper band, with the GMA as your profit target. The indicator includes alerts for band touches and crosses, providing real-time notifications with symbol, timeframe, current price, and band level information. The default 100-period setting works well for daily charts, but can be adjusted shorter (20-50) for intraday trading or longer (200+) for position trading. Wider bands indicate higher volatility (use smaller positions), while narrower bands suggest lower volatility (larger positions possible). For best results, confirm signals with volume and avoid trading against strong trends. Stop losses can be placed beyond the touched band or at the GMA line, depending on your risk tolerance.
릴리즈 노트
- added filter to display extreme areas
릴리즈 노트
- updated alert message
오픈 소스 스크립트
트레이딩뷰의 진정한 정신에 따라, 이 스크립트의 작성자는 이를 오픈소스로 공개하여 트레이더들이 기능을 검토하고 검증할 수 있도록 했습니다. 작성자에게 찬사를 보냅니다! 이 코드는 무료로 사용할 수 있지만, 코드를 재게시하는 경우 하우스 룰이 적용된다는 점을 기억하세요.
면책사항
해당 정보와 게시물은 금융, 투자, 트레이딩 또는 기타 유형의 조언이나 권장 사항으로 간주되지 않으며, 트레이딩뷰에서 제공하거나 보증하는 것이 아닙니다. 자세한 내용은 이용 약관을 참조하세요.
오픈 소스 스크립트
트레이딩뷰의 진정한 정신에 따라, 이 스크립트의 작성자는 이를 오픈소스로 공개하여 트레이더들이 기능을 검토하고 검증할 수 있도록 했습니다. 작성자에게 찬사를 보냅니다! 이 코드는 무료로 사용할 수 있지만, 코드를 재게시하는 경우 하우스 룰이 적용된다는 점을 기억하세요.
면책사항
해당 정보와 게시물은 금융, 투자, 트레이딩 또는 기타 유형의 조언이나 권장 사항으로 간주되지 않으며, 트레이딩뷰에서 제공하거나 보증하는 것이 아닙니다. 자세한 내용은 이용 약관을 참조하세요.