OPEN-SOURCE SCRIPT
Frank-Shorting Setup ✅ (RSI + RS only)
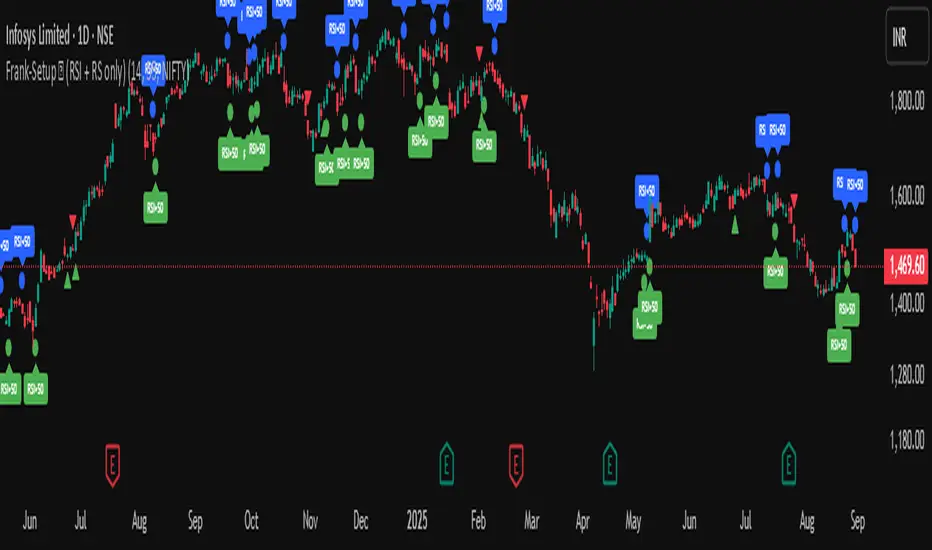
An indicator designed to help traders spot weakness in a stock by combining RSI and Relative Strength (RS) analysis.
🔹 Key Features
RSI Weakness Signals
Marks when RSI falls below 50 (downside pressure begins).
Marks when RSI moves back above 50 (weakness ends).
Relative Strength (RS) vs Benchmark
Compares stock performance to a benchmark (e.g., NIFTY).
Signals when RS drops below 1 (stock underperforming).
Signals when RS moves back above 1 (strength resumes).
Clear Chart Markings
Circles for RSI signals.
Triangles for RS signals.
Optional labels for extra clarity.
Alerts Built-In
Get notified when RSI or RS weakness starts/ends.
No need to monitor charts all the time
오픈 소스 스크립트
트레이딩뷰의 진정한 정신에 따라, 이 스크립트의 작성자는 이를 오픈소스로 공개하여 트레이더들이 기능을 검토하고 검증할 수 있도록 했습니다. 작성자에게 찬사를 보냅니다! 이 코드는 무료로 사용할 수 있지만, 코드를 재게시하는 경우 하우스 룰이 적용된다는 점을 기억하세요.
면책사항
해당 정보와 게시물은 금융, 투자, 트레이딩 또는 기타 유형의 조언이나 권장 사항으로 간주되지 않으며, 트레이딩뷰에서 제공하거나 보증하는 것이 아닙니다. 자세한 내용은 이용 약관을 참조하세요.
오픈 소스 스크립트
트레이딩뷰의 진정한 정신에 따라, 이 스크립트의 작성자는 이를 오픈소스로 공개하여 트레이더들이 기능을 검토하고 검증할 수 있도록 했습니다. 작성자에게 찬사를 보냅니다! 이 코드는 무료로 사용할 수 있지만, 코드를 재게시하는 경우 하우스 룰이 적용된다는 점을 기억하세요.
면책사항
해당 정보와 게시물은 금융, 투자, 트레이딩 또는 기타 유형의 조언이나 권장 사항으로 간주되지 않으며, 트레이딩뷰에서 제공하거나 보증하는 것이 아닙니다. 자세한 내용은 이용 약관을 참조하세요.