INVITE-ONLY SCRIPT
Flow of fund (FOF) indicator
Flow of fund (FOF) simply refers to the direction of money in the market. FOF indicator shows how the flow of funds impacts market price.
The idea of this indicator is very intuitive, prices raise when cash flowing into the market and drop when cash flowing out of market.
The calculation of FOF involves three basic but the most important elements of the financial market: TIME, PRICE and VOLUME.
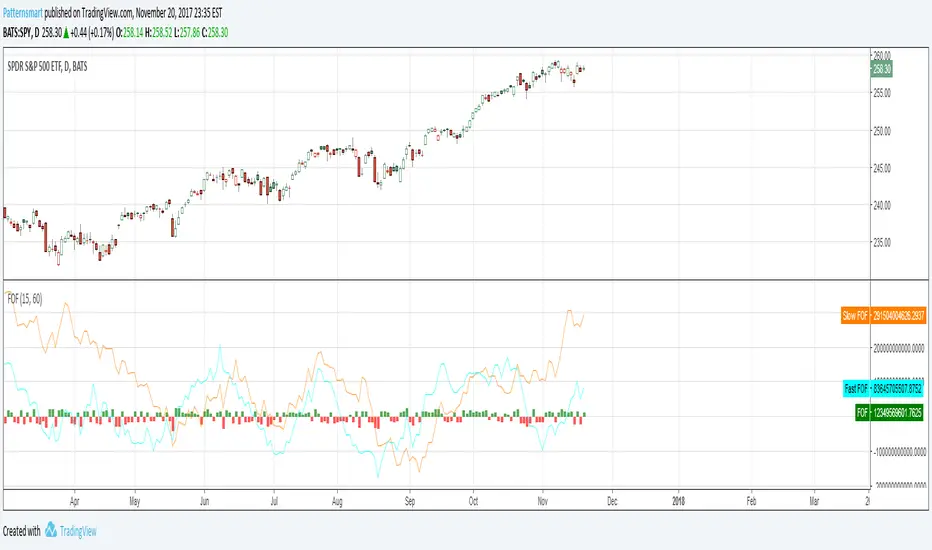
Flow of fund indicator consists of two parts:
HISTOGRAM shows the total amount of money get in or out of the market within 1 bar.
If selling pressure is stronger than buying pressure, it will be a red bar,
otherwise, it will be a green bar.
Two Flow of fund trend lines, indicating the short and long term movement of money flow.
Fast trend line uses a shorter period of time.
Slow trend line uses a longer period of time.
The length of period of both trend line is adjustable by user.
The orange line in the images is slow FOF, the blue line is fast FOF.
It works within all time period (Tick, Minutes, Daily, Weekly, Monthly) with VOLUME.
초대 전용 스크립트
이 스크립트는 작성자가 승인한 사용자만 접근할 수 있습니다. 사용하려면 요청 후 승인을 받아야 하며, 일반적으로 결제 후에 허가가 부여됩니다. 자세한 내용은 아래 작성자의 안내를 따르거나 Patternsmart에게 직접 문의하세요.
트레이딩뷰는 스크립트의 작동 방식을 충분히 이해하고 작성자를 완전히 신뢰하지 않는 이상, 해당 스크립트에 비용을 지불하거나 사용하는 것을 권장하지 않습니다. 커뮤니티 스크립트에서 무료 오픈소스 대안을 찾아보실 수도 있습니다.
작성자 지시 사항
면책사항
해당 정보와 게시물은 금융, 투자, 트레이딩 또는 기타 유형의 조언이나 권장 사항으로 간주되지 않으며, 트레이딩뷰에서 제공하거나 보증하는 것이 아닙니다. 자세한 내용은 이용 약관을 참조하세요.