OPEN-SOURCE SCRIPT
업데이트됨 Aleem Trend Supertrend EMA
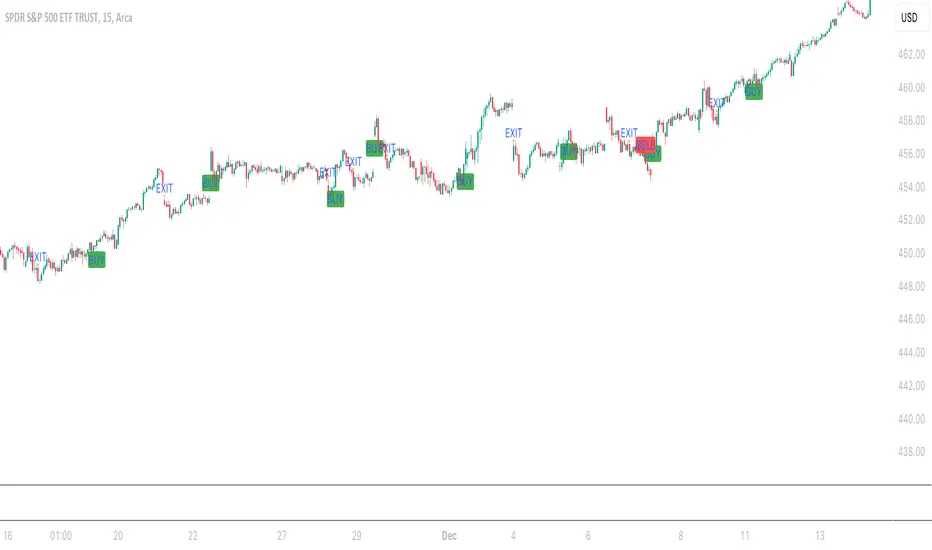
Title: "Supertrend and 200 EMA Crossover Strategy"
Description:
This script is designed to provide traders with a robust and original trading strategy by combining the Supertrend indicator with a 200-period Exponential Moving Average (EMA). The core concept is to utilize the strengths of both indicators to determine optimal entry and exit points.
The Supertrend indicator is well-regarded for its precision in signaling trend reversals by considering the volatility of the market, as measured by the Average True Range (ATR). It is particularly useful for identifying ongoing trends and potential reversals.
The 200 EMA is a widely-used indicator that many traders look to as a determinant of the long-term trend. When the price is above the 200 EMA, the overall market sentiment is considered bullish, and when below, bearish.
By combining these two, the script generates a Buy signal under the following conditions:
When the Supertrend turns bullish (color changes from red to green) with the closing price above the 200 EMA, or
When the price crosses above the 200 EMA while the Supertrend is already green.
A Sell signal is generated when:
The Supertrend turns bearish (color changes from green to red) with the closing price below the 200 EMA, or
The price crosses below the 200 EMA while the Supertrend is already red.
To avoid repetitive signals and to maintain clarity, the script has been enhanced with a feature to prevent multiple consecutive Buy or Sell signals. Once a Buy or Sell signal is generated, the script will not produce another identical signal until an opposing signal or an exit condition is met.
Exit signals for both Buy and Sell positions are provided to indicate when the trend is weakening or reversing, based on the Supertrend's color change in relation to the 200 EMA.
This strategy is flexible and can be utilized across various time frames and asset classes. It aims to aid traders in making more informed decisions by highlighting potential reversals and continuations in the market trend.
Usage:
To use this script, traders should observe the Buy and Sell signals as potential entry points. Exit signals should be taken as prompts to close positions or to protect profits with stop-loss adjustments. As with all strategies, it's recommended to use this in conjunction with other analysis methods and to backtest thoroughly before live implementation.
릴리즈 노트
Title: "Supertrend and 200 EMA Crossover Strategy"Description:
This script is designed to provide traders with a robust and original trading strategy by combining the Supertrend indicator with a 200-period Exponential Moving Average (EMA). The core concept is to utilize the strengths of both indicators to determine optimal entry and exit points.
The Supertrend indicator is well-regarded for its precision in signaling trend reversals by considering the volatility of the market, as measured by the Average True Range (ATR). It is particularly useful for identifying ongoing trends and potential reversals.
The 200 EMA is a widely-used indicator that many traders look to as a determinant of the long-term trend. When the price is above the 200 EMA, the overall market sentiment is considered bullish, and when below, bearish.
By combining these two, the script generates a Buy signal under the following conditions:
When the Supertrend turns bullish (color changes from red to green) with the closing price above the 200 EMA, or
When the price crosses above the 200 EMA while the Supertrend is already green.
A Sell signal is generated when:
The Supertrend turns bearish (color changes from green to red) with the closing price below the 200 EMA, or
The price crosses below the 200 EMA while the Supertrend is already red.
To avoid repetitive signals and to maintain clarity, the script has been enhanced with a feature to prevent multiple consecutive Buy or Sell signals. Once a Buy or Sell signal is generated, the script will not produce another identical signal until an opposing signal or an exit condition is met.
Exit signals for both Buy and Sell positions are provided to indicate when the trend is weakening or reversing, based on the Supertrend's color change in relation to the 200 EMA.
This strategy is flexible and can be utilized across various time frames and asset classes. It aims to aid traders in making more informed decisions by highlighting potential reversals and continuations in the market trend.
Usage:
To use this script, traders should observe the Buy and Sell signals as potential entry points. Exit signals should be taken as prompts to close positions or to protect profits with stop-loss adjustments. As with all strategies, it's recommended to use this in conjunction with other analysis methods and to backtest thoroughly before live implementation.
오픈 소스 스크립트
트레이딩뷰의 진정한 정신에 따라, 이 스크립트의 작성자는 이를 오픈소스로 공개하여 트레이더들이 기능을 검토하고 검증할 수 있도록 했습니다. 작성자에게 찬사를 보냅니다! 이 코드는 무료로 사용할 수 있지만, 코드를 재게시하는 경우 하우스 룰이 적용된다는 점을 기억하세요.
면책사항
해당 정보와 게시물은 금융, 투자, 트레이딩 또는 기타 유형의 조언이나 권장 사항으로 간주되지 않으며, 트레이딩뷰에서 제공하거나 보증하는 것이 아닙니다. 자세한 내용은 이용 약관을 참조하세요.
오픈 소스 스크립트
트레이딩뷰의 진정한 정신에 따라, 이 스크립트의 작성자는 이를 오픈소스로 공개하여 트레이더들이 기능을 검토하고 검증할 수 있도록 했습니다. 작성자에게 찬사를 보냅니다! 이 코드는 무료로 사용할 수 있지만, 코드를 재게시하는 경우 하우스 룰이 적용된다는 점을 기억하세요.
면책사항
해당 정보와 게시물은 금융, 투자, 트레이딩 또는 기타 유형의 조언이나 권장 사항으로 간주되지 않으며, 트레이딩뷰에서 제공하거나 보증하는 것이 아닙니다. 자세한 내용은 이용 약관을 참조하세요.