OPEN-SOURCE SCRIPT
업데이트됨 Ichimoku MA Bands
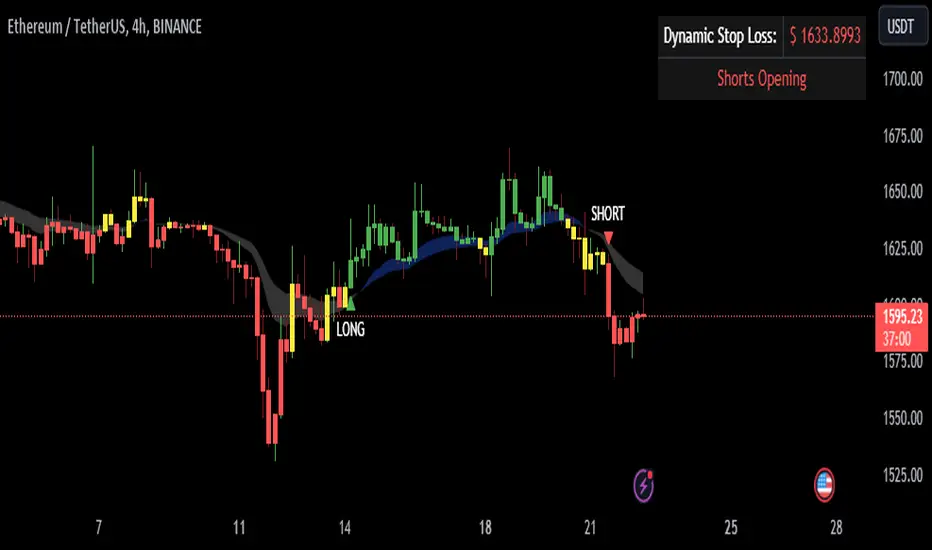
This indicator is based on the price average of the Ichimoku Strategy taking into account the last twenty five bars.
The blue band represents an upward momentum whereas the white band represents a downward momentum.
The red line is the 50 EMA which is used as a dynamic support resistance level for this strategy.
This indicator also has alerts that can be enabled by the user.
Disclaimer:
The current script should be used in confluence with other trading strategies and not in isolation. The scripts works best on 5M and 15M Timeframes and should be used with caution on lower timeframes.
This indicator is not intended to give exact entry or exit points for a trade but to provide a general idea of the trend & determine a good range for entering or exiting the trade. Please DYOR
Credit & References:
This script uses the default technical analysis reference library provided by PineScript (denoted as ta)
릴리즈 노트
- Added Labels for potential Buy and Sell candles- Updated Dynamic S&R from EMA50 to a multiple of ATR
- Updated Alerts
오픈 소스 스크립트
트레이딩뷰의 진정한 정신에 따라, 이 스크립트의 작성자는 이를 오픈소스로 공개하여 트레이더들이 기능을 검토하고 검증할 수 있도록 했습니다. 작성자에게 찬사를 보냅니다! 이 코드는 무료로 사용할 수 있지만, 코드를 재게시하는 경우 하우스 룰이 적용된다는 점을 기억하세요.
면책사항
해당 정보와 게시물은 금융, 투자, 트레이딩 또는 기타 유형의 조언이나 권장 사항으로 간주되지 않으며, 트레이딩뷰에서 제공하거나 보증하는 것이 아닙니다. 자세한 내용은 이용 약관을 참조하세요.
오픈 소스 스크립트
트레이딩뷰의 진정한 정신에 따라, 이 스크립트의 작성자는 이를 오픈소스로 공개하여 트레이더들이 기능을 검토하고 검증할 수 있도록 했습니다. 작성자에게 찬사를 보냅니다! 이 코드는 무료로 사용할 수 있지만, 코드를 재게시하는 경우 하우스 룰이 적용된다는 점을 기억하세요.
면책사항
해당 정보와 게시물은 금융, 투자, 트레이딩 또는 기타 유형의 조언이나 권장 사항으로 간주되지 않으며, 트레이딩뷰에서 제공하거나 보증하는 것이 아닙니다. 자세한 내용은 이용 약관을 참조하세요.