OPEN-SOURCE SCRIPT
Linear Regression Trendline on Close
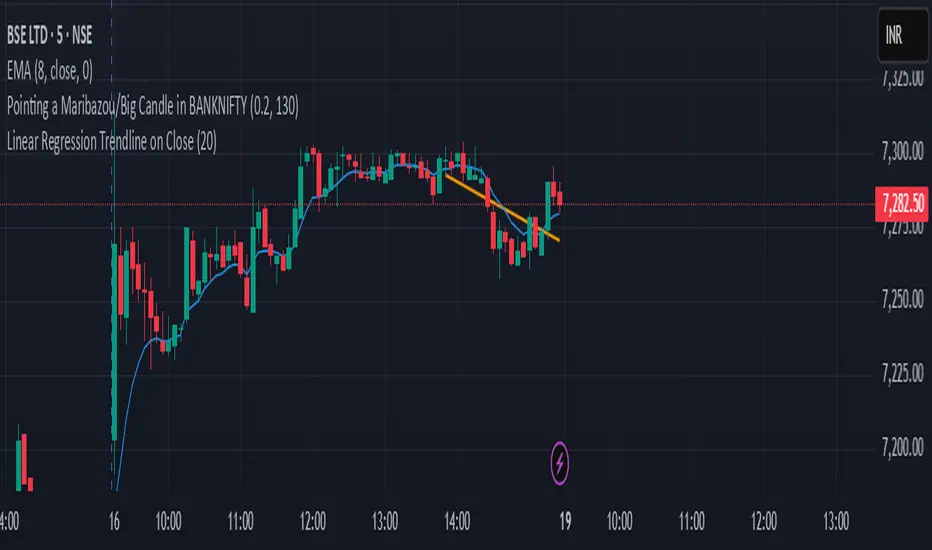
This indicator draws a linear regression trendline that connects the closing prices of the last N candles, where N is a user-defined input.
🔹 Key Features:
Uses least-squares linear regression to fit a straight line to recent closes
Automatically adapts to any timeframe (5min, 1h, daily, etc.)
Input lets you select how many recent candles to include
Helps identify short-term trend direction and momentum
🔸 How to Use:
Set the "Number of Candles" input to choose how far back the regression line should look
The line updates in real time as new candles form
Use it to gauge short-term bias, or combine with support/resistance/zones for confirmation
🧠 Tip: Increase the number of candles for smoother trends; decrease for more reactive trendlines.
오픈 소스 스크립트
트레이딩뷰의 진정한 정신에 따라, 이 스크립트의 작성자는 이를 오픈소스로 공개하여 트레이더들이 기능을 검토하고 검증할 수 있도록 했습니다. 작성자에게 찬사를 보냅니다! 이 코드는 무료로 사용할 수 있지만, 코드를 재게시하는 경우 하우스 룰이 적용된다는 점을 기억하세요.
면책사항
해당 정보와 게시물은 금융, 투자, 트레이딩 또는 기타 유형의 조언이나 권장 사항으로 간주되지 않으며, 트레이딩뷰에서 제공하거나 보증하는 것이 아닙니다. 자세한 내용은 이용 약관을 참조하세요.
오픈 소스 스크립트
트레이딩뷰의 진정한 정신에 따라, 이 스크립트의 작성자는 이를 오픈소스로 공개하여 트레이더들이 기능을 검토하고 검증할 수 있도록 했습니다. 작성자에게 찬사를 보냅니다! 이 코드는 무료로 사용할 수 있지만, 코드를 재게시하는 경우 하우스 룰이 적용된다는 점을 기억하세요.
면책사항
해당 정보와 게시물은 금융, 투자, 트레이딩 또는 기타 유형의 조언이나 권장 사항으로 간주되지 않으며, 트레이딩뷰에서 제공하거나 보증하는 것이 아닙니다. 자세한 내용은 이용 약관을 참조하세요.