INVITE-ONLY SCRIPT
[KRONOS] Deviations
Description
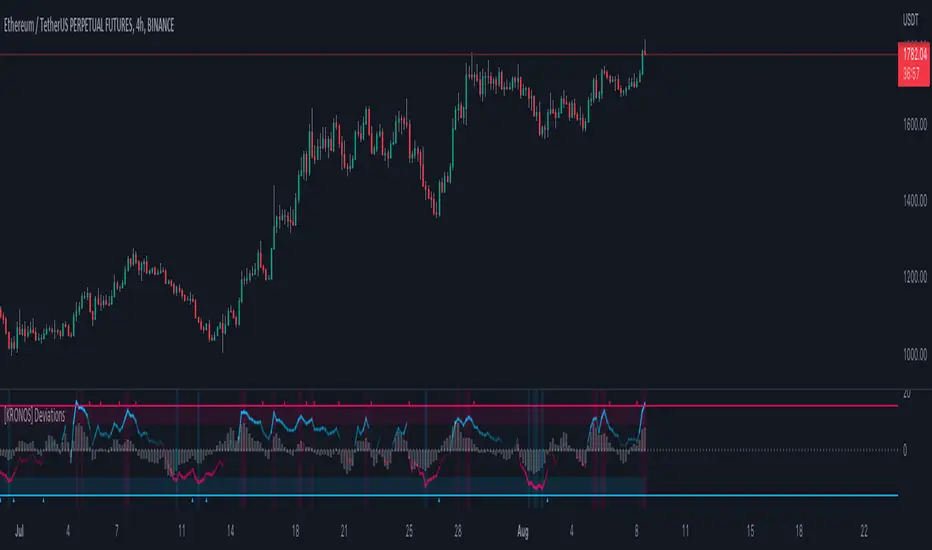
This indicator calculates the differences between the current price and the local support or resistance, and normalizes it into a range.
The value basis is calculated from a defined period of time that is then multiplied to get a standard deviations and a max. and min. value subtracted and divided into a final value.
It includes
Extreme zones. This value appears as blue and red lines which deviates from the oversold to overbought range.
Momentum. Lower time frame momentum is represented by a gray histogram as well as a signal line oscillating from a red to blue color.
Strong reversal. Red ( bearish ) and blue ( bullish ) columns will appear on the histogram when our algorithm detects that the strength of momentum is coming to an end indicative of a trend reversal.
Trend confirmation. Red or blue arrows will act as a trend confirmation.
Support and resistance . The zero line will frequently serve as a S/R area.
Divergences. You can use this indicator to detect potential pivot areas.
How to use?
Sell/Short when the histogram shows a red column and the signal line is in or above the overbought area (colored in red).
Buy/Long when the histogram shows a blue column and the signal line is in or below the oversold area (colored in blue).
extra tip: if you entered a trade based on the above conditions, you can partially increase your position each time you see a confirmation arrow.
초대 전용 스크립트
이 스크립트는 작성자가 승인한 사용자만 접근할 수 있습니다. 사용하려면 요청 후 승인을 받아야 하며, 일반적으로 결제 후에 허가가 부여됩니다. 자세한 내용은 아래 작성자의 안내를 따르거나 kronos-algo에게 직접 문의하세요.
트레이딩뷰는 스크립트의 작동 방식을 충분히 이해하고 작성자를 완전히 신뢰하지 않는 이상, 해당 스크립트에 비용을 지불하거나 사용하는 것을 권장하지 않습니다. 커뮤니티 스크립트에서 무료 오픈소스 대안을 찾아보실 수도 있습니다.
작성자 지시 사항
Learn more at: https://kronos-trading.com/indicators
Our indicators are suitable for all markets: Crypto, Forex, stocks, etc.
Learn more at: kronos-trading.com/indicators
Our indicators are suitable for all markets: Crypto, Forex, stocks, etc.
Our indicators are suitable for all markets: Crypto, Forex, stocks, etc.
면책사항
해당 정보와 게시물은 금융, 투자, 트레이딩 또는 기타 유형의 조언이나 권장 사항으로 간주되지 않으며, 트레이딩뷰에서 제공하거나 보증하는 것이 아닙니다. 자세한 내용은 이용 약관을 참조하세요.