OPEN-SOURCE SCRIPT
Multi-Crypto Principal Component Analysis
Version 0.2
## 📌 Multi-Crypto Principal Component Analysis (PCA) — Indicator Summary
### 🎯 Purpose
This indicator identifies **cryptocurrency assets that are behaving differently** from the rest of the market, using a simplified approach inspired by Principal Component Analysis (PCA). It’s designed to help traders spot **cross-market divergences**, detect outliers, and improve asset selection and correlation-based strategies.
### ⚙️ How It Works
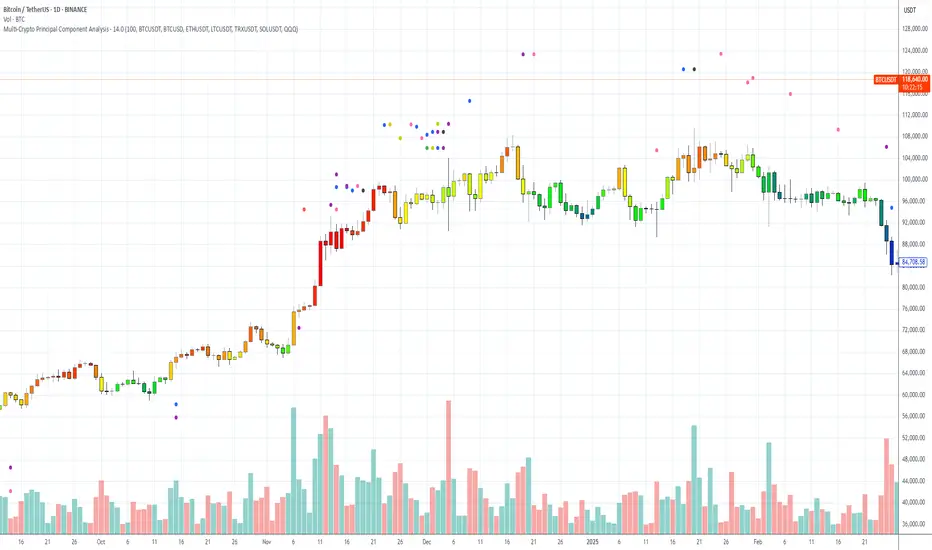
The indicator analyzes the **log returns** of up to 7 user-defined assets over a configurable lookback period (default: 100 bars). It computes the **z-score** (standardized deviation) for each asset’s return series and compares it against the average behavior of the group.
If an asset’s behavior deviates significantly (beyond a threshold of 1.5 standard deviations), it’s flagged as an **outlier**.
- Each outlier is plotted as a **colored dot horizontally spaced** above the price bar
- Up to **3 dots per bar** are shown for visual clarity
This PCA-style detection works in real time, directly on the chart, and gives you a quick overview of which assets are breaking correlation.
### 🔧 Inputs
- 🕒 **Lookback Period**: Number of bars to analyze (default: 100)
- 🔢 **Assets 1–7**: Choose any 7 crypto symbols from any exchange
- 🎨 **Colors**: Predefined per asset (e.g. BTCUSDT = red, ETHUSDT = yellow)
- 📈 **Threshold**: Internal (1.5 std dev); adjustable in code if needed
### 📊 Outputs
- 🟢 Dots above candles representing assets that are acting as outliers
- 🧠 Real-time clustering insight based on statistical deviation
- 🧭 Spatially spaced dots to avoid visual overlap when multiple outliers appear
### ⚠️ Limitations
- This is a **PCA-inspired approximation**, not true matrix-based PCA
- It does **not compute principal components or eigenvectors**
- Sensitivity may vary with asset volatility or sparse trading data
- Real PCA requires external tools like Python or R for full dimensional analysis
This tool is ideal for traders who want real-time crypto correlation insights without needing external data science platforms. It’s lightweight, fast, and highly visual — and gives you a powerful lens into market dislocations across multiple assets.
## 📌 Multi-Crypto Principal Component Analysis (PCA) — Indicator Summary
### 🎯 Purpose
This indicator identifies **cryptocurrency assets that are behaving differently** from the rest of the market, using a simplified approach inspired by Principal Component Analysis (PCA). It’s designed to help traders spot **cross-market divergences**, detect outliers, and improve asset selection and correlation-based strategies.
### ⚙️ How It Works
The indicator analyzes the **log returns** of up to 7 user-defined assets over a configurable lookback period (default: 100 bars). It computes the **z-score** (standardized deviation) for each asset’s return series and compares it against the average behavior of the group.
If an asset’s behavior deviates significantly (beyond a threshold of 1.5 standard deviations), it’s flagged as an **outlier**.
- Each outlier is plotted as a **colored dot horizontally spaced** above the price bar
- Up to **3 dots per bar** are shown for visual clarity
This PCA-style detection works in real time, directly on the chart, and gives you a quick overview of which assets are breaking correlation.
### 🔧 Inputs
- 🕒 **Lookback Period**: Number of bars to analyze (default: 100)
- 🔢 **Assets 1–7**: Choose any 7 crypto symbols from any exchange
- 🎨 **Colors**: Predefined per asset (e.g. BTCUSDT = red, ETHUSDT = yellow)
- 📈 **Threshold**: Internal (1.5 std dev); adjustable in code if needed
### 📊 Outputs
- 🟢 Dots above candles representing assets that are acting as outliers
- 🧠 Real-time clustering insight based on statistical deviation
- 🧭 Spatially spaced dots to avoid visual overlap when multiple outliers appear
### ⚠️ Limitations
- This is a **PCA-inspired approximation**, not true matrix-based PCA
- It does **not compute principal components or eigenvectors**
- Sensitivity may vary with asset volatility or sparse trading data
- Real PCA requires external tools like Python or R for full dimensional analysis
This tool is ideal for traders who want real-time crypto correlation insights without needing external data science platforms. It’s lightweight, fast, and highly visual — and gives you a powerful lens into market dislocations across multiple assets.
오픈 소스 스크립트
트레이딩뷰의 진정한 정신에 따라, 이 스크립트의 작성자는 이를 오픈소스로 공개하여 트레이더들이 기능을 검토하고 검증할 수 있도록 했습니다. 작성자에게 찬사를 보냅니다! 이 코드는 무료로 사용할 수 있지만, 코드를 재게시하는 경우 하우스 룰이 적용된다는 점을 기억하세요.
면책사항
해당 정보와 게시물은 금융, 투자, 트레이딩 또는 기타 유형의 조언이나 권장 사항으로 간주되지 않으며, 트레이딩뷰에서 제공하거나 보증하는 것이 아닙니다. 자세한 내용은 이용 약관을 참조하세요.
오픈 소스 스크립트
트레이딩뷰의 진정한 정신에 따라, 이 스크립트의 작성자는 이를 오픈소스로 공개하여 트레이더들이 기능을 검토하고 검증할 수 있도록 했습니다. 작성자에게 찬사를 보냅니다! 이 코드는 무료로 사용할 수 있지만, 코드를 재게시하는 경우 하우스 룰이 적용된다는 점을 기억하세요.
면책사항
해당 정보와 게시물은 금융, 투자, 트레이딩 또는 기타 유형의 조언이나 권장 사항으로 간주되지 않으며, 트레이딩뷰에서 제공하거나 보증하는 것이 아닙니다. 자세한 내용은 이용 약관을 참조하세요.