OPEN-SOURCE SCRIPT
Dashboard Trends
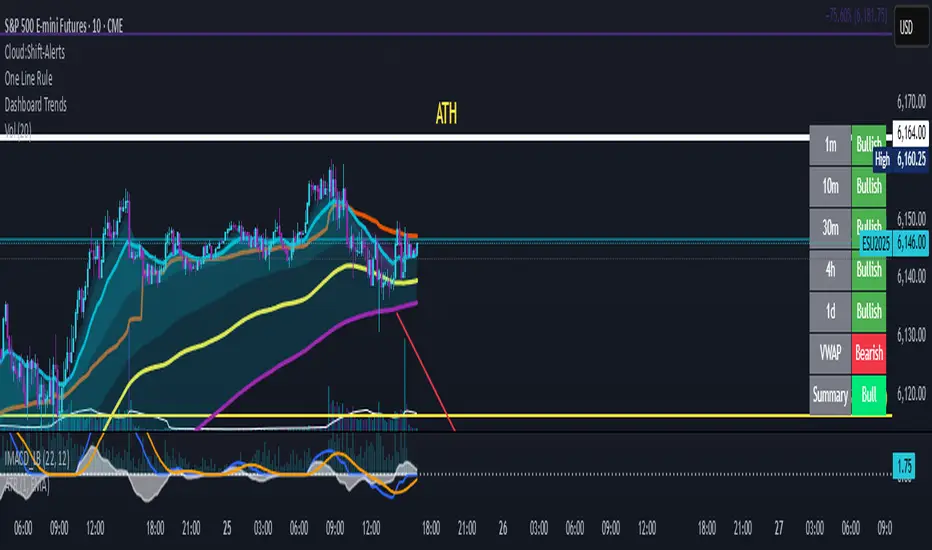
📊 Dashboard Trends + Anchored Daily VWAP
This indicator provides a real-time multi-timeframe trend dashboard alongside a daily anchored VWAP system, helping you assess both macro and intraday market sentiment at a glance.
🔍 Key Features
✅ Multi-Timeframe Trend Analysis
Tracks whether EMA(22) is above EMA(200) across:
1m, 10m, 30m, 4h, 1D timeframes
Color-coded "Bullish"/"Bearish" status for each
Aggregated trend summary using 6 signals (including VWAP)
✅ Anchored Daily VWAP
Uses ta.vwap to provide a session-resetting daily VWAP
VWAP resets at the beginning of each trading day
Live update throughout the day
Supports pre-market and after-hours if chart includes ETH
✅ VWAP Bands (±1σ to ±3σ)
Optional bands show price deviation from VWAP
Fully customizable:
Enable/disable each band
Set deviation multiplier
Adjust color and visibility
✅ Visual Dashboard
Table display in the bottom-right corner
Shows trend status per timeframe + VWAP + Summary
Easy-to-read green/yellow/red color codes
⚙️ Customization
Toggle VWAP line on/off
Enable or disable any band level
Adjust standard deviation multiplier
Choose your VWAP and band colors
🧠 Summary Logic
Strong Bull: 6 bullish signals
Bull: 5 signals
Mixed: 3–4 signals
Bear: 2 signals
Strong Bear: 0–1 signals
This tool is perfect for traders looking to combine trend-following and intraday mean-reversion awareness, with all the critical data visualized in one compact dashboard.
오픈 소스 스크립트
트레이딩뷰의 진정한 정신에 따라, 이 스크립트의 작성자는 이를 오픈소스로 공개하여 트레이더들이 기능을 검토하고 검증할 수 있도록 했습니다. 작성자에게 찬사를 보냅니다! 이 코드는 무료로 사용할 수 있지만, 코드를 재게시하는 경우 하우스 룰이 적용된다는 점을 기억하세요.
면책사항
해당 정보와 게시물은 금융, 투자, 트레이딩 또는 기타 유형의 조언이나 권장 사항으로 간주되지 않으며, 트레이딩뷰에서 제공하거나 보증하는 것이 아닙니다. 자세한 내용은 이용 약관을 참조하세요.
오픈 소스 스크립트
트레이딩뷰의 진정한 정신에 따라, 이 스크립트의 작성자는 이를 오픈소스로 공개하여 트레이더들이 기능을 검토하고 검증할 수 있도록 했습니다. 작성자에게 찬사를 보냅니다! 이 코드는 무료로 사용할 수 있지만, 코드를 재게시하는 경우 하우스 룰이 적용된다는 점을 기억하세요.
면책사항
해당 정보와 게시물은 금융, 투자, 트레이딩 또는 기타 유형의 조언이나 권장 사항으로 간주되지 않으며, 트레이딩뷰에서 제공하거나 보증하는 것이 아닙니다. 자세한 내용은 이용 약관을 참조하세요.