INVITE-ONLY SCRIPT
업데이트됨 Trend, Chart Patterns & Market Structure Indicator [TradeDots]
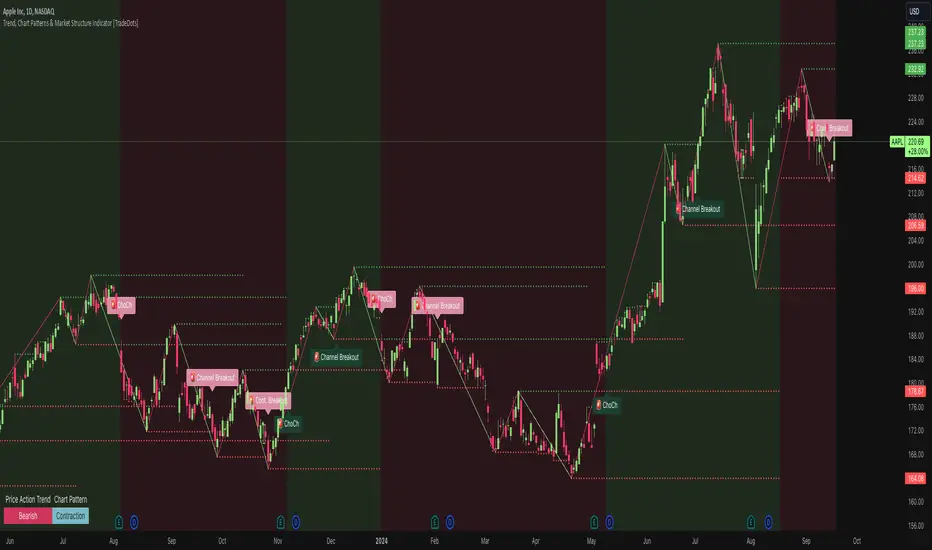
The "Trend, Chart Patterns & Market Structure Indicator" is engineered to identify pivotal price action points, revealing shifts in market dynamics. This tool aids traders to simplify any trading market in recognizing significant price levels, enhancing decision-making in diverse market conditions.
📝 HOW IT WORKS
Pivot Identification
The indicator detects pivots in price action using a complex mathematical model by analyzing a window of candlesticks to capture significant reversal patterns. It examines a series of bars, focusing on their open, high, low, close, and changes in these values, to pinpoint potential market turning points.
Support and Resistance Lines
Chart Patterns Analysis

Market Structure Shifts
Types of Market Structure Shifts
🛠️ HOW TO USE
Chart Visualization
Reversal Signals
❗️LIMITATIONS
RISK DISCLAIMER
Trading involves substantial risk, and most traders may incur losses. All content, tools, scripts, articles, and education provided by TradeDots are for informational and educational purposes only.
📝 HOW IT WORKS
Pivot Identification
The indicator detects pivots in price action using a complex mathematical model by analyzing a window of candlesticks to capture significant reversal patterns. It examines a series of bars, focusing on their open, high, low, close, and changes in these values, to pinpoint potential market turning points.
Support and Resistance Lines
- Calculation: Automatically draws lines at key price pivots in bullish and bearish markets.
- Significance: Aligning support and resistance levels highlights strong demand or supply zones, reinforcing trading biases. When multiple lines converge near a price level, it indicates robust support or resistance, as many traders focus on these levels for placing trades.
Chart Patterns Analysis
- Formation: Utilizes four pivots to identify patterns such as ascending/descending channels, contraction, and expansion patterns.
- Visualization: Background colors (green for bullish, red for bearish) help identify market trends.
Market Structure Shifts
- Detection: Identifies price breakouts above or below previous support and resistance, indicating changes in market structure.
- Confirmation: Highlights shifts in market character, aiding in trend reversal anticipation.
Types of Market Structure Shifts
- Channel Breakout: The price breaks out from the current channel's resistance level.
- Rev. Breakout: The price breaks out from a contraction pattern, moving in the opposite direction of the previous market trend.
- Continuation Breakout: The price breaks out from a contraction pattern, continuing the previous market trend.
- Change of Character (ChoCh): The price breaks out from either support or resistance, causing a change in the market trend.
🛠️ HOW TO USE
Chart Visualization
- Color Coding: Background colors signify market trends, with green indicating bullish and red indicating bearish conditions.
- Pattern Recognition: Identifies and labels patterns, providing insights into current market sentiment.
Reversal Signals
- Signal Labels: Detects shifts in market structure indicating potential entry and exit points.
❗️LIMITATIONS
- Market Noise: Accuracy may decrease in volatile and noisy markets.
- Trend Confirmation Delay: Market trends are only confirmed once the price breaks out from support or resistance, potentially causing delays.
RISK DISCLAIMER
Trading involves substantial risk, and most traders may incur losses. All content, tools, scripts, articles, and education provided by TradeDots are for informational and educational purposes only.
릴리즈 노트
- Improved trend detector accuracy
- Minor bug fix
초대 전용 스크립트
이 스크립트는 작성자가 승인한 사용자만 접근할 수 있습니다. 사용하려면 요청 후 승인을 받아야 하며, 일반적으로 결제 후에 허가가 부여됩니다. 자세한 내용은 아래 작성자의 안내를 따르거나 tradedots에게 직접 문의하세요.
트레이딩뷰는 스크립트의 작동 방식을 충분히 이해하고 작성자를 완전히 신뢰하지 않는 이상, 해당 스크립트에 비용을 지불하거나 사용하는 것을 권장하지 않습니다. 커뮤니티 스크립트에서 무료 오픈소스 대안을 찾아보실 수도 있습니다.
작성자 지시 사항
Get access to our exclusive indicators: tradedots.xyz All content provided by TradeDots is for informational & educational purposes only. Past performance does not guarantee future results.
면책사항
해당 정보와 게시물은 금융, 투자, 트레이딩 또는 기타 유형의 조언이나 권장 사항으로 간주되지 않으며, 트레이딩뷰에서 제공하거나 보증하는 것이 아닙니다. 자세한 내용은 이용 약관을 참조하세요.