PROTECTED SOURCE SCRIPT
업데이트됨 Daily Structure Cycles - Session - PDH/PDL

Description:
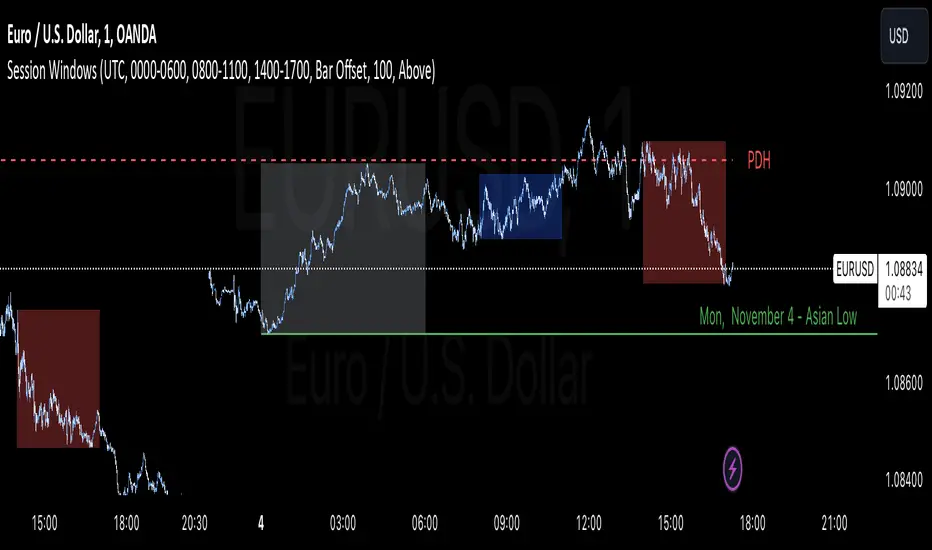
The Session Windows indicator visualizes predefined trading sessions on the chart, highlighting key price ranges with customizable background colors and labels. Designed to track session-specific high and low levels, this tool provides visual guidance for analyzing market behavior across different trading windows. It includes three customizable sessions—Asian, Window 1, and Window 2—that can be toggled on or off.
How It Works:
Each session is marked with a colored box, representing the high and low range for that session. Border colors and box transparency can be customized, allowing for easy visual differentiation.
The indicator also displays the high and low levels of the previous day, marked as PDH (Previous Day High) and PDL (Previous Day Low). When the current price crosses these levels, the line style changes, signaling potential support or resistance levels.
Labels for each session high and low are positioned based on the user-defined offset and alignment options, providing easy-to-read markers at the end of each session.
Usage: This indicator helps traders observe price behavior within distinct trading sessions and how the current price interacts with previous day’s highs and lows, which may offer insight into support/resistance zones. Traders can use this tool to spot breakout or reversal points as price moves through session highs/lows or crosses the previous day’s levels.
Customization Options:
Session Settings: Choose session times for Asian, Window 1, and Window 2.
Color Settings: Set different colors for session background and border lines.
Label Positioning: Adjust label offset and vertical position for high/low markers.
PDH/PDL Levels: Toggle lines for previous day’s high and low, with color and line style options.
Limitations: This indicator is designed for visualization purposes and is best used alongside other tools for confirmation, as it does not provide standalone buy or sell signals.
릴리즈 노트
Description:The Session Windows indicator visualizes predefined trading sessions on the chart, highlighting key price ranges with customizable background colors and labels. Designed to track session-specific high and low levels, this tool provides visual guidance for analyzing market behavior across different trading windows. It includes three customizable sessions—Asian, Window 1, and Window 2—that can be toggled on or off.
How It Works:
Each session is marked with a colored box, representing the high and low range for that session. Border colors and box transparency can be customized, allowing for easy visual differentiation.
The indicator also displays the high and low levels of the previous day, marked as PDH (Previous Day High) and PDL (Previous Day Low). When the current price crosses these levels, the line style changes, signaling potential support or resistance levels.
Labels for each session high and low are positioned based on the user-defined offset and alignment options, providing easy-to-read markers at the end of each session.
Usage: This indicator helps traders observe price behavior within distinct trading sessions and how the current price interacts with previous day’s highs and lows, which may offer insight into support/resistance zones. Traders can use this tool to spot breakout or reversal points as price moves through session highs/lows or crosses the previous day’s levels.
Customization Options:
Session Settings: Choose session times for Asian, Window 1, and Window 2.
Color Settings: Set different colors for session background and border lines.
Label Positioning: Adjust label offset and vertical position for high/low markers.
PDH/PDL Levels: Toggle lines for previous day’s high and low, with color and line style options.
Limitations: This indicator is designed for visualization purposes and is best used alongside other tools for confirmation, as it does not provide standalone buy or sell signals.
보호된 스크립트입니다
이 스크립트는 비공개 소스로 게시됩니다. 하지만 이를 자유롭게 제한 없이 사용할 수 있습니다 – 자세한 내용은 여기에서 확인하세요.
면책사항
해당 정보와 게시물은 금융, 투자, 트레이딩 또는 기타 유형의 조언이나 권장 사항으로 간주되지 않으며, 트레이딩뷰에서 제공하거나 보증하는 것이 아닙니다. 자세한 내용은 이용 약관을 참조하세요.
보호된 스크립트입니다
이 스크립트는 비공개 소스로 게시됩니다. 하지만 이를 자유롭게 제한 없이 사용할 수 있습니다 – 자세한 내용은 여기에서 확인하세요.
면책사항
해당 정보와 게시물은 금융, 투자, 트레이딩 또는 기타 유형의 조언이나 권장 사항으로 간주되지 않으며, 트레이딩뷰에서 제공하거나 보증하는 것이 아닙니다. 자세한 내용은 이용 약관을 참조하세요.