OPEN-SOURCE SCRIPT
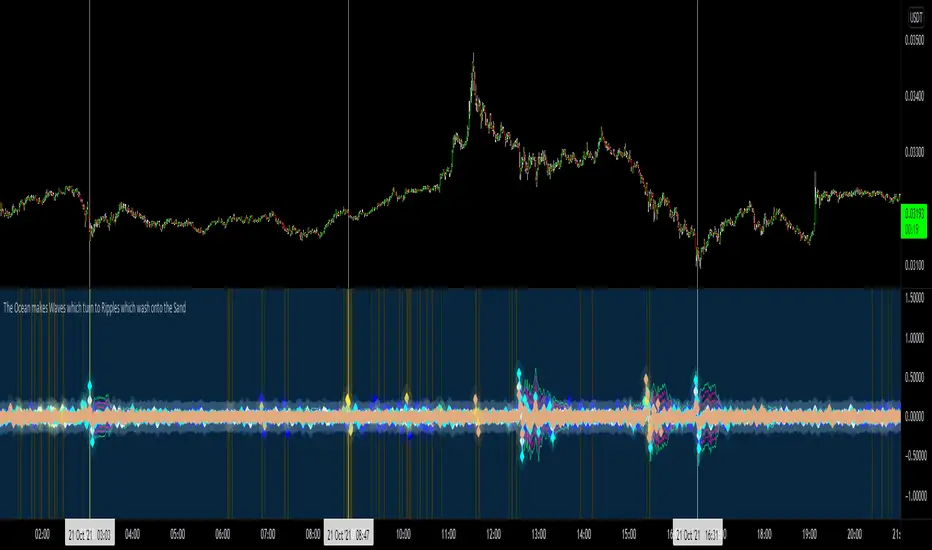
OWRS Volatililility

Bit of a fun indicator taking into the asset names and natural processes and also the fact that the crypto markets are (definitely) not run by weird occultists and naturalists. Looks for disturbances in price of these four key assets. Read into it what you will. Sometimes the clues are just in the names.
Things you will learn from this script:
1. Using security function to compare multiple assets in one indicator.
2. Using indexing to reference historic data.
3. Setting chart outputs such as color based on interrogation of a boolean.
4. To only go back 3-4 iterations of any repeatable sequence as chaos kicks in after 3.55 (Feigenbaum)
1. By extension only the last 3 or 4 candles are of any use in indicator creation.
2. I am almost definitely a pagan.
3. You were expecting this numbered list to go 1,2,3,4,5,6,7. na mate. Chaos.
오픈 소스 스크립트
트레이딩뷰의 진정한 정신에 따라, 이 스크립트의 작성자는 이를 오픈소스로 공개하여 트레이더들이 기능을 검토하고 검증할 수 있도록 했습니다. 작성자에게 찬사를 보냅니다! 이 코드는 무료로 사용할 수 있지만, 코드를 재게시하는 경우 하우스 룰이 적용된다는 점을 기억하세요.
면책사항
해당 정보와 게시물은 금융, 투자, 트레이딩 또는 기타 유형의 조언이나 권장 사항으로 간주되지 않으며, 트레이딩뷰에서 제공하거나 보증하는 것이 아닙니다. 자세한 내용은 이용 약관을 참조하세요.
오픈 소스 스크립트
트레이딩뷰의 진정한 정신에 따라, 이 스크립트의 작성자는 이를 오픈소스로 공개하여 트레이더들이 기능을 검토하고 검증할 수 있도록 했습니다. 작성자에게 찬사를 보냅니다! 이 코드는 무료로 사용할 수 있지만, 코드를 재게시하는 경우 하우스 룰이 적용된다는 점을 기억하세요.
면책사항
해당 정보와 게시물은 금융, 투자, 트레이딩 또는 기타 유형의 조언이나 권장 사항으로 간주되지 않으며, 트레이딩뷰에서 제공하거나 보증하는 것이 아닙니다. 자세한 내용은 이용 약관을 참조하세요.