INVITE-ONLY SCRIPT
Trend vs Mean Reversion Indicator (ADF Test) {DCAquant}
ADF Trend/Mean Reversion Analysis Indicator {DCAquant}
The ADF Trend/Mean Reversion Analysis Indicator, is a groundbreaking tool engineered to discern the underlying structure of financial markets. It employs the esteemed Augmented Dickey-Fuller (ADF) test to analyze time series data, providing traders with a robust statistical basis to distinguish between trending and mean-reverting market environments.
Comprehensive Market Analysis:
Advanced Statistical Foundation: Leverages the ADF test to statistically evaluate the likelihood of a trend sustaining or a reversion to the mean, making it a critical component of a quantitative trader’s toolkit.
Market Condition Visualization: The indicator’s color-coded system serves as a visual guide to the current market state, helping traders identify shifts in market dynamics with ease.
Configurable Sensitivity: Customizable parameters allow for fine-tuning the indicator's responsiveness, ensuring adaptability across various assets and market conditions.
Enhanced Indicator Features:
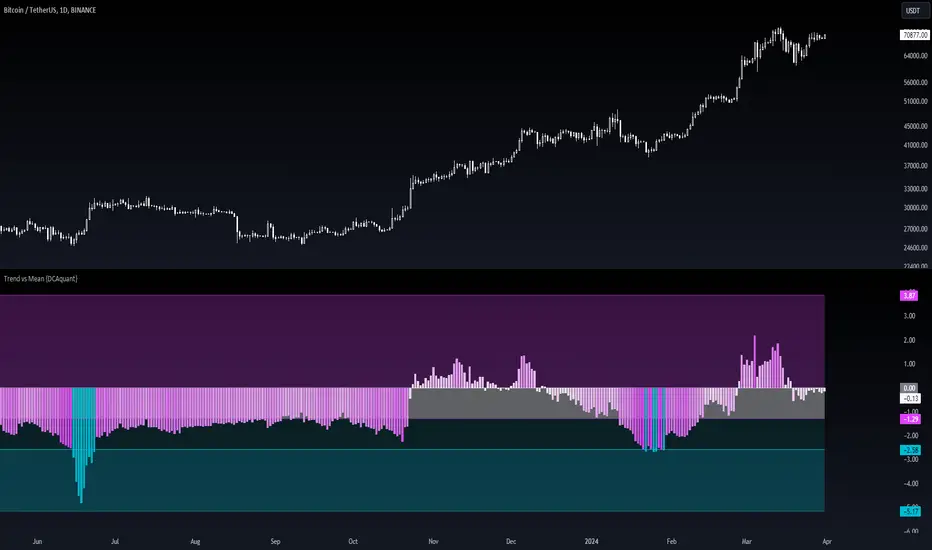
Aqua and Teal Bars: Depict a market that is statistically more inclined toward mean reversion, potentially signaling retracements or reversals, hence providing strategic points for counter-trend entries.
Fuchsia and Purple Bars: Identify a trending market regime where the persistence of price direction is statistically significant, thus supporting strategies that follow the trend.
Adaptive to Market Caps and Assets: Whether applied to broad market indices or individual securities, this indicator dynamically adjusts, making it an invaluable asset for diverse trading portfolios.
Strategic Trading Implications:
Dual-Strategy Adaptation: The indicator's nuanced presentation allows traders to switch between trend-following and counter-trend strategies, providing a flexible approach to both long-term investors and short-term traders.
Robust Signal Confirmation: It enhances trade confirmation when used alongside other technical indicators such as moving averages, momentum oscillators, or volume-based measures, offering a multi-layered analysis.
Informed Decision Making: By understanding the statistical tendencies of market behavior, traders can make more informed decisions that align with their individual risk profiles and trading objectives.
Customization and Optimization:
Selectable Confidence Levels: Choose from 90%, 95%, or 99% confidence levels to match the statistical rigor with your risk appetite.
Flexible Source and Lookback Periods: Adjust the price source and historical window to optimize the ADF test's application to different trading styles and timeframes, from intra-day to long-term analysis.
In-depth Indicator Usage:
Mean Reversion Opportunities: Utilize the indicator's mean-reverting signals to identify potential tops or bottoms, and adjust your position sizes and stop-loss placements accordingly.
Trend Continuation: In trending phases, use the indicator’s readings to reinforce your conviction in holding positions, managing trades with the confidence of statistical backing.
Disclaimer and Best Practices:
The ADF Trend/Mean Reversion Analysis Indicator {DCAquant} represents a fusion of statistical theory and technical analysis, designed to augment the trader's insight. It is intended to be used as a component of a holistic trading strategy. While it offers a sophisticated analysis, all traders are advised to apply rigorous risk management and not to rely solely on one indicator for trading signals.
The ADF Trend/Mean Reversion Analysis Indicator, is a groundbreaking tool engineered to discern the underlying structure of financial markets. It employs the esteemed Augmented Dickey-Fuller (ADF) test to analyze time series data, providing traders with a robust statistical basis to distinguish between trending and mean-reverting market environments.
Comprehensive Market Analysis:
Advanced Statistical Foundation: Leverages the ADF test to statistically evaluate the likelihood of a trend sustaining or a reversion to the mean, making it a critical component of a quantitative trader’s toolkit.
Market Condition Visualization: The indicator’s color-coded system serves as a visual guide to the current market state, helping traders identify shifts in market dynamics with ease.
Configurable Sensitivity: Customizable parameters allow for fine-tuning the indicator's responsiveness, ensuring adaptability across various assets and market conditions.
Enhanced Indicator Features:
Aqua and Teal Bars: Depict a market that is statistically more inclined toward mean reversion, potentially signaling retracements or reversals, hence providing strategic points for counter-trend entries.
Fuchsia and Purple Bars: Identify a trending market regime where the persistence of price direction is statistically significant, thus supporting strategies that follow the trend.
Adaptive to Market Caps and Assets: Whether applied to broad market indices or individual securities, this indicator dynamically adjusts, making it an invaluable asset for diverse trading portfolios.
Strategic Trading Implications:
Dual-Strategy Adaptation: The indicator's nuanced presentation allows traders to switch between trend-following and counter-trend strategies, providing a flexible approach to both long-term investors and short-term traders.
Robust Signal Confirmation: It enhances trade confirmation when used alongside other technical indicators such as moving averages, momentum oscillators, or volume-based measures, offering a multi-layered analysis.
Informed Decision Making: By understanding the statistical tendencies of market behavior, traders can make more informed decisions that align with their individual risk profiles and trading objectives.
Customization and Optimization:
Selectable Confidence Levels: Choose from 90%, 95%, or 99% confidence levels to match the statistical rigor with your risk appetite.
Flexible Source and Lookback Periods: Adjust the price source and historical window to optimize the ADF test's application to different trading styles and timeframes, from intra-day to long-term analysis.
In-depth Indicator Usage:
Mean Reversion Opportunities: Utilize the indicator's mean-reverting signals to identify potential tops or bottoms, and adjust your position sizes and stop-loss placements accordingly.
Trend Continuation: In trending phases, use the indicator’s readings to reinforce your conviction in holding positions, managing trades with the confidence of statistical backing.
Disclaimer and Best Practices:
The ADF Trend/Mean Reversion Analysis Indicator {DCAquant} represents a fusion of statistical theory and technical analysis, designed to augment the trader's insight. It is intended to be used as a component of a holistic trading strategy. While it offers a sophisticated analysis, all traders are advised to apply rigorous risk management and not to rely solely on one indicator for trading signals.
초대 전용 스크립트
이 스크립트는 작성자가 승인한 사용자만 접근할 수 있습니다. 사용하려면 요청 후 승인을 받아야 하며, 일반적으로 결제 후에 허가가 부여됩니다. 자세한 내용은 아래 작성자의 안내를 따르거나 DCAquant에게 직접 문의하세요.
이 비공개 초대 전용 스크립트는 스크립트 모더레이터의 검토를 거치지 않았으며, 하우스 룰 준수 여부는 확인되지 않았습니다. 트레이딩뷰는 스크립트의 작동 방식을 충분히 이해하고 작성자를 완전히 신뢰하지 않는 이상, 해당 스크립트에 비용을 지불하거나 사용하는 것을 권장하지 않습니다. 커뮤니티 스크립트에서 무료 오픈소스 대안을 찾아보실 수도 있습니다.
작성자 지시 사항
Please visit dcaquant.com or contact us via info@dcaquant.com or directly on TradingView.
면책사항
해당 정보와 게시물은 금융, 투자, 트레이딩 또는 기타 유형의 조언이나 권장 사항으로 간주되지 않으며, 트레이딩뷰에서 제공하거나 보증하는 것이 아닙니다. 자세한 내용은 이용 약관을 참조하세요.