PROTECTED SOURCE SCRIPT
업데이트됨 Mioone´s TEMA100vsEMA800(Feat. ACEACEACE)
Mioone´s TEMA100vsEMA800(Feat. ACEACEACE)
Inspired by CryptoAman better know as ACEACEACE
TEMA1000 vs EMA800
What does it do?
Shows the TEMA1000 in relation to EMA800.
Shows the Coin in relation to EMA800
If you look at the value of the coins, you will notice that the coin magically moves closer to the EMA800.
That's why I created the indicator with the relation of the Coin to the EMA800 as a addon, so you can see how many bucks the Coin can go up or down when it is looking for the proximity to the EMA800.
Basically:
If the TEMA1000 goes below EMA800 the signal is rather bearish.
If the TEMA1000 breaks up through the EMA800 on larger time frames, this can often produce a DIP or start a run up.
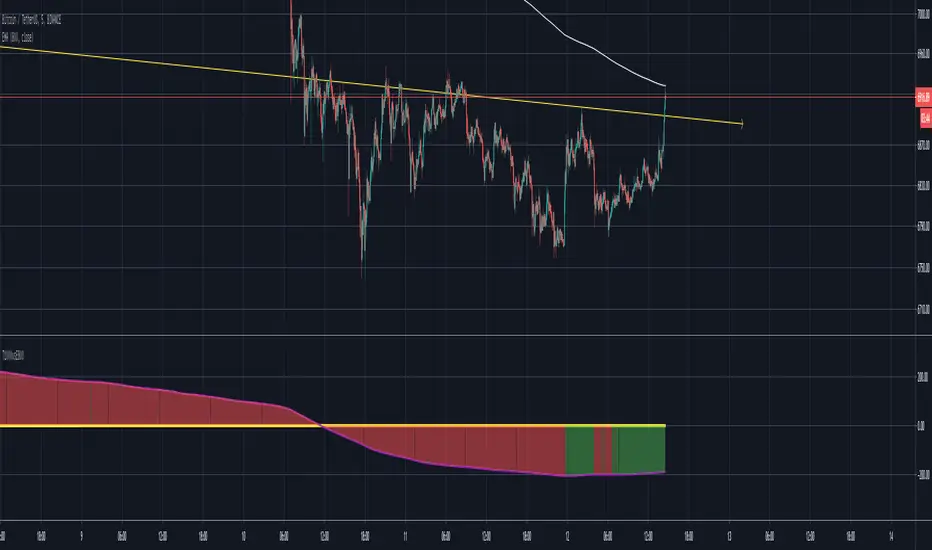
Yelloline = Null Line
Greenline = Coinvalue smoothed with EMA1 in relation to EMA800 (Means if EMA800 = 10.000$ and CoinValue = 10.200$ the Greenline shows the Difference +200 $ over EMA800
Purpleline = TEMA1000 in Relation to EMA800 (TEMA1000 over EMA800 = Bullish , Under EMA800 = Bearish)
Colorfilling
Filling Green if Coinvalue (EMA9) > EMA800 = Bullish
Filling Red if Coinvalue (ema9) < EMA800 = Bearish)
Purple Crossover Yello = Bullcross
Purple Crossunder Yello = Bearcross
Take care of your Trades....
Mioone
Inspired by CryptoAman better know as ACEACEACE
TEMA1000 vs EMA800
What does it do?
Shows the TEMA1000 in relation to EMA800.
Shows the Coin in relation to EMA800
If you look at the value of the coins, you will notice that the coin magically moves closer to the EMA800.
That's why I created the indicator with the relation of the Coin to the EMA800 as a addon, so you can see how many bucks the Coin can go up or down when it is looking for the proximity to the EMA800.
Basically:
If the TEMA1000 goes below EMA800 the signal is rather bearish.
If the TEMA1000 breaks up through the EMA800 on larger time frames, this can often produce a DIP or start a run up.
Yelloline = Null Line
Greenline = Coinvalue smoothed with EMA1 in relation to EMA800 (Means if EMA800 = 10.000$ and CoinValue = 10.200$ the Greenline shows the Difference +200 $ over EMA800
Purpleline = TEMA1000 in Relation to EMA800 (TEMA1000 over EMA800 = Bullish , Under EMA800 = Bearish)
Colorfilling
Filling Green if Coinvalue (EMA9) > EMA800 = Bullish
Filling Red if Coinvalue (ema9) < EMA800 = Bearish)
Purple Crossover Yello = Bullcross
Purple Crossunder Yello = Bearcross
Take care of your Trades....
Mioone
릴리즈 노트
The histogram decreases from the value -> This is generally a bearish signalThe histogram increases in value -> This is generally a bullish signal
Principle rules:
Place a long into a bullish signal (Green Lines)
Place a short into a bearish signal (Red Lines)
Going against the trend is a high risk.
Small Update:
It is now displayed when a trend has changed from the last value (green and red lines). Thus a trend reversal can be seen better.
Translated with DeepL.com/Translator (free version)
보호된 스크립트입니다
이 스크립트는 비공개 소스로 게시됩니다. 하지만 이를 자유롭게 제한 없이 사용할 수 있습니다 – 자세한 내용은 여기에서 확인하세요.
면책사항
해당 정보와 게시물은 금융, 투자, 트레이딩 또는 기타 유형의 조언이나 권장 사항으로 간주되지 않으며, 트레이딩뷰에서 제공하거나 보증하는 것이 아닙니다. 자세한 내용은 이용 약관을 참조하세요.
면책사항
해당 정보와 게시물은 금융, 투자, 트레이딩 또는 기타 유형의 조언이나 권장 사항으로 간주되지 않으며, 트레이딩뷰에서 제공하거나 보증하는 것이 아닙니다. 자세한 내용은 이용 약관을 참조하세요.