OPEN-SOURCE SCRIPT
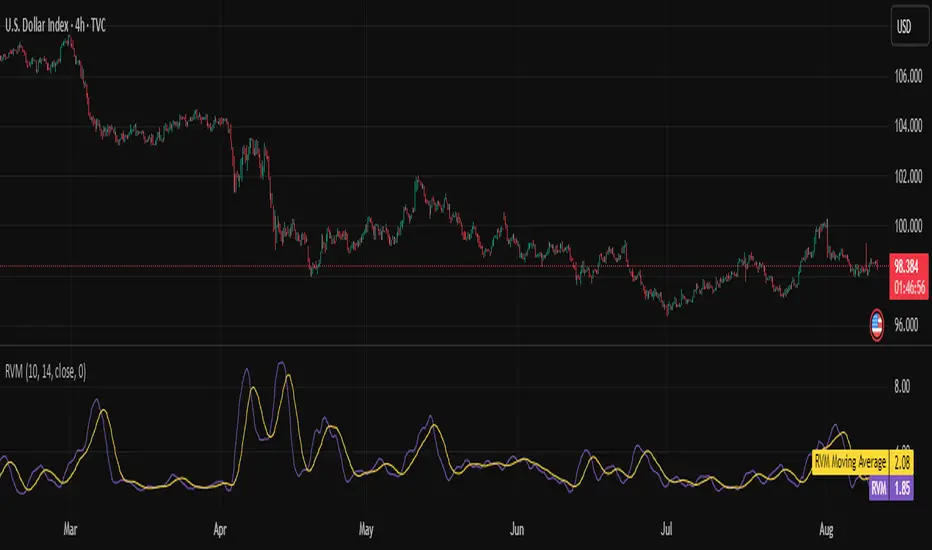
Relative Volatility Mass [SciQua]

The ⚖️ Relative Volatility Mass (RVM) is a volatility-based tool inspired by the Relative Volatility Index (RVI).
While the RVI measures the ratio of upward to downward volatility over a period, RVM takes a different approach:
This makes RVM particularly useful for identifying sustained high-volatility conditions without being diluted by averaging.
────────────────────────────────────────────────────────────
╭────────────╮
How It Works
╰────────────╯
1. Standard Deviation Calculation
• Computes the standard deviation of the chosen `Source` over a `Standard Deviation Length` (`stdDevLen`).
2. Directional Separation
• Volatility on up bars (`chg > 0`) is treated as upward volatility.
• Volatility on down bars (`chg < 0`) is treated as downward volatility.
3. Rolling Sum
• Over a `Sum Length` (`sumLen`), the upward and downward volatilities are summed separately using `math.sum()`.
4. Relative Volatility Mass
• The two sums are added together to get the total volatility mass for the rolling window.
Formula:
RVM = Σ(σup) + Σ(σdown)
where σ is the standard deviation over `stdDevLen`.
╭────────────╮
Key Features
╰────────────╯
╭─────╮
Usage
╰─────╯
RVM is not bounded like the RVI, so absolute values depend on market volatility and chosen parameters.
Consider normalizing or using smoothing for easier visual comparison.
╭────────────────╮
Example Settings
╰────────────────╯
╭───────────────────╮
Notes & Limitations
╰───────────────────╯
╭───────╮
Credits
╰───────╯
While the RVI measures the ratio of upward to downward volatility over a period, RVM takes a different approach:
- It sums the standard deviation of price changes over a rolling window, separating upward volatility from downward volatility.
- The result is a measure of the total “volatility mass” over a user-defined period, rather than an average or normalized ratio.
This makes RVM particularly useful for identifying sustained high-volatility conditions without being diluted by averaging.
────────────────────────────────────────────────────────────
╭────────────╮
How It Works
╰────────────╯
1. Standard Deviation Calculation
• Computes the standard deviation of the chosen `Source` over a `Standard Deviation Length` (`stdDevLen`).
2. Directional Separation
• Volatility on up bars (`chg > 0`) is treated as upward volatility.
• Volatility on down bars (`chg < 0`) is treated as downward volatility.
3. Rolling Sum
• Over a `Sum Length` (`sumLen`), the upward and downward volatilities are summed separately using `math.sum()`.
4. Relative Volatility Mass
• The two sums are added together to get the total volatility mass for the rolling window.
Formula:
RVM = Σ(σup) + Σ(σdown)
where σ is the standard deviation over `stdDevLen`.
╭────────────╮
Key Features
╰────────────╯
- Directional Volatility Tracking – Differentiates between volatility during price advances vs. declines.
- Rolling Volatility Mass – Shows the total standard deviation accumulation over a given period.
- Optional Smoothing – Multiple MA types, including SMA, EMA, SMMA (RMA), WMA, VWMA.
- Bollinger Band Overlay – Available when SMA is selected, with adjustable standard deviation multiplier.
- Configurable Source – Apply RVM to `close`, `open`, `hl2`, or any custom source.
╭─────╮
Usage
╰─────╯
- Trend Confirmation: High RVM values can confirm strong trending conditions.
- Breakout Detection: Spikes in RVM often precede or accompany price breakouts.
- Volatility Cycle Analysis: Compare periods of contraction and expansion.
RVM is not bounded like the RVI, so absolute values depend on market volatility and chosen parameters.
Consider normalizing or using smoothing for easier visual comparison.
╭────────────────╮
Example Settings
╰────────────────╯
- Short-term volatility detection: `stdDevLen = 5`, `sumLen = 10`
- Medium-term trend volatility: `stdDevLen = 14`, `sumLen = 20`
- Enable `SMA + Bollinger Bands` to visualize when volatility is unusually high or low relative to recent history.
╭───────────────────╮
Notes & Limitations
╰───────────────────╯
- Not a directional signal by itself — use alongside price structure, volume, or other indicators.
- Higher `sumLen` will smooth short-term fluctuations but reduce responsiveness.
- Because it sums, not averages, values will scale with both volatility and chosen window size.
╭───────╮
Credits
╰───────╯
- Based on the Relative Volatility Index concept by Donald Dorsey (1993).
- TradingView
- SciQua - Joshua Danford
오픈 소스 스크립트
트레이딩뷰의 진정한 정신에 따라, 이 스크립트의 작성자는 이를 오픈소스로 공개하여 트레이더들이 기능을 검토하고 검증할 수 있도록 했습니다. 작성자에게 찬사를 보냅니다! 이 코드는 무료로 사용할 수 있지만, 코드를 재게시하는 경우 하우스 룰이 적용된다는 점을 기억하세요.
🚀 Founder of SciQua | Strategy. Simulation. Signals.
TradingView indicators, backtesting tools, weekly contests, and live market analysis.
Join free, compete, win, and stay updated at sciqua.com
TradingView indicators, backtesting tools, weekly contests, and live market analysis.
Join free, compete, win, and stay updated at sciqua.com
면책사항
해당 정보와 게시물은 금융, 투자, 트레이딩 또는 기타 유형의 조언이나 권장 사항으로 간주되지 않으며, 트레이딩뷰에서 제공하거나 보증하는 것이 아닙니다. 자세한 내용은 이용 약관을 참조하세요.