PROTECTED SOURCE SCRIPT
Liquidation Bands (+CVD Bubbles) - By Leviathan
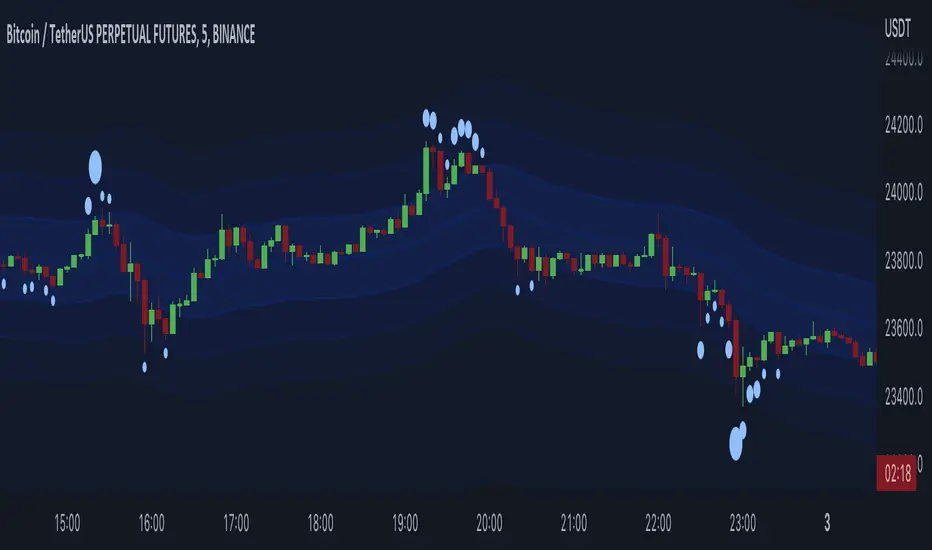
Along with CVD bubbles, this script plots continuous bands that represent 100x, 75x, 50x, 25x liquidation levels. The bands can serve as support/resistance, reversal points, expected volatility range and more.
The indicator uses either the Exponential Moving Average (EMA) or the Volume Weighted Average Price (VWAP) as a base for plotting continuous lines and zones set at the approximate distance of 100x, 75x, 50x, 25x leverage liquidation prices.
These bands can help you visualize:
- Dynamic Support and Resistance levels
- Levels that the price will gravitate towards
- Expected price range (potential volatility)
- Reversal points
- ...
The "CVD Bubbles" part of this script plots circles that are based on my imitation of Cumulative Volume Delta (CVD).
CVD Bubbles will appear when buy/sell volume is increased. The larger the bubble, the more buying/selling at that candle.
"Buy Order" CVD Bubbles appear above candles and might signal:
- Late longers entering the market
- Large short liquidations (closed short=buy order)
- Large market buys getting absorbed by limit sell orders
=> Bias: potential reversal to the downside
"Sell Order" CVD Bubbles appear below candles and might signal:
- Late shorters entering the market
- Large long liquidations (closed long=sell order)
- Large market sells getting absorbed by limit buy orders
=> Bias: potential reversal to the upside
Combining Liquidation Bands and CVD Bubbles can serve you as confluence for taking a trade, but don't follow them blindly.
Settings:
"Mode" - Choose the base for Liquidation Bands (EMA or VWAP)
"EMA/CVD Length" - Choose the length (number of bars) for calculating EMA and CVD
"Level Calculation Mode" - Choose between 3 variations of calculating the distance to Liquidation Bands
"Standard Deviation Length" - Choose the length used for calculating the thresholds of CVD
"Appearance" - Choose the colors of lines, zones and CVD Bubbles
"STDEV MULT." - Multiply the thresholds used for CVD Bubble Sizes
보호된 스크립트입니다
이 스크립트는 비공개 소스로 게시됩니다. 하지만 이를 자유롭게 제한 없이 사용할 수 있습니다 – 자세한 내용은 여기에서 확인하세요.
면책사항
해당 정보와 게시물은 금융, 투자, 트레이딩 또는 기타 유형의 조언이나 권장 사항으로 간주되지 않으며, 트레이딩뷰에서 제공하거나 보증하는 것이 아닙니다. 자세한 내용은 이용 약관을 참조하세요.
보호된 스크립트입니다
이 스크립트는 비공개 소스로 게시됩니다. 하지만 이를 자유롭게 제한 없이 사용할 수 있습니다 – 자세한 내용은 여기에서 확인하세요.
면책사항
해당 정보와 게시물은 금융, 투자, 트레이딩 또는 기타 유형의 조언이나 권장 사항으로 간주되지 않으며, 트레이딩뷰에서 제공하거나 보증하는 것이 아닙니다. 자세한 내용은 이용 약관을 참조하세요.