PROTECTED SOURCE SCRIPT
업데이트됨 RSI Price Calculator by eXeTrade ( RSIpc )
Simply calculates required price to achieve target RSI value.
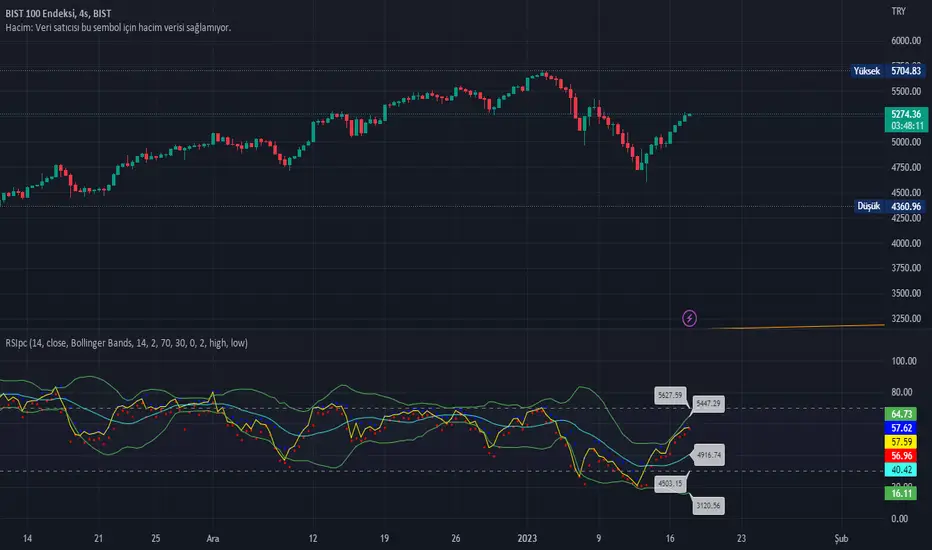
At standart RSI graph we only see bar close (or selected value like high/low) RSI values but there are spikes at RSI like price bars. There are kown working (resistance or support) RSI levels, you may want to set some orders to these RSI values but it is impossible to set Sell/Buy orders for RSI values at standart brokers. You need price value for target RSI & this calculator calculates this price value for you.
As default it calculates prices for Moving Average & Bollinger Bands (if selected)
User can set Upper & Lower band values (Default as 70 & 30)
Values calculated for active bar.
As example
if RSI upper bollinger working good as resistance you can set sell order at calculated price for upper bollinger.
릴리즈 노트
RSI spike values added for last bar.If RSI calculation selected from close values all RSI is calculated with close but at this version dotted values show high & low values of RSI.
Calculation example
Close selected for RSI calculation and period (N) =14
Previous 13 bars RSI calculated with close value. Final bar dotted RSI values calculated with high & low for last bar.
Usage
For price graphic some anaysts select spike points for trend analysis but this can not be done with standart RSI. By the help of dots you can do same analysis for RSI.
보호된 스크립트입니다
이 스크립트는 비공개 소스로 게시됩니다. 하지만 이를 자유롭게 제한 없이 사용할 수 있습니다 – 자세한 내용은 여기에서 확인하세요.
면책사항
해당 정보와 게시물은 금융, 투자, 트레이딩 또는 기타 유형의 조언이나 권장 사항으로 간주되지 않으며, 트레이딩뷰에서 제공하거나 보증하는 것이 아닙니다. 자세한 내용은 이용 약관을 참조하세요.
면책사항
해당 정보와 게시물은 금융, 투자, 트레이딩 또는 기타 유형의 조언이나 권장 사항으로 간주되지 않으며, 트레이딩뷰에서 제공하거나 보증하는 것이 아닙니다. 자세한 내용은 이용 약관을 참조하세요.