OPEN-SOURCE SCRIPT
Advanced MVRV Trend Analyzer
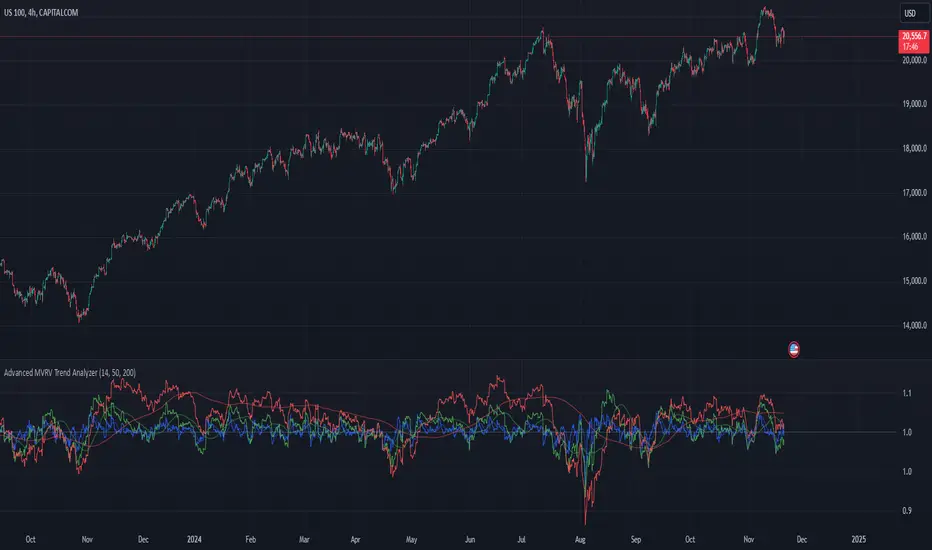
The "Advanced MVRV Trend Analyzer" is a sophisticated trading tool designed for the TradingView platform that enhances traditional Market Value to Realized Value (MVRV) analysis. It provides a multi-timeframe perspective of market valuation dynamics by comparing the current market price to the realized price across short-term, mid-term, and long-term cohorts. This indicator is particularly useful for cryptocurrency traders and investors who seek deeper insights into potential overvaluation or undervaluation conditions in the market.
Key Features
Multiple Timeframes:
Analyzes market conditions across three distinct timeframes: short-term (14 days), mid-term (50 days), and long-term (200 days).
Moving Averages: Includes moving averages for each MVRV ratio to smooth out short-term fluctuations and highlight longer-term trends.
Dynamic Thresholds: Provides dynamic color-coded backgrounds that highlight overvalued and undervalued market conditions based on predefined thresholds.
How to Use
Adding the Indicator:
Open your TradingView chart.
Click on "Indicators" at the top of your screen.
Search for "Advanced MVRV Trend Analyzer" and add it to your chart.
Interpreting the Indicator:
MVRV Lines: Each of the three MVRV lines (short-term, mid-term, long-term) reflects how much higher or lower the current market price is compared to the average price at which coins were last moved. A value above 1 indicates that the current price is higher than the realized price, suggesting overvaluation. Conversely, a value below 1 suggests undervaluation.
Moving Averages: The moving averages of the MVRV ratios help identify the underlying trend. If the MVRV line deviates significantly from its moving average, it might indicate a potential reversal or continuation of the current trend.
Color-coded Backgrounds:
Red background indicates an overvalued condition where the MVRV ratio exceeds 1.5, suggesting caution as the market may be overheated.
Green background indicates an undervalued condition where the MVRV ratio is below 0.5, potentially signaling a buying opportunity.
Trading Strategies:
Overvalued Zones: Consider taking profits or setting stop-loss orders when the indicator shows a prolonged red background, especially if supported by other bearish signals.
Undervalued Zones: Look for buying opportunities when the indicator shows a prolonged green background, especially if other bullish signals are present.
Combining with Other Indicators:
Enhance your analysis by combining the "Advanced MVRV Trend Analyzer" with other technical indicators such as RSI, MACD, or volume-based tools to confirm trends and signals.
Conclusion
The "Advanced MVRV Trend Analyzer" offers a nuanced view of market dynamics, providing traders with valuable insights into when a market may be approaching extremes. By utilizing this indicator, traders can better time their entries and exits, manage risk, and align their strategies with underlying market trends.
오픈 소스 스크립트
트레이딩뷰의 진정한 정신에 따라, 이 스크립트의 작성자는 이를 오픈소스로 공개하여 트레이더들이 기능을 검토하고 검증할 수 있도록 했습니다. 작성자에게 찬사를 보냅니다! 이 코드는 무료로 사용할 수 있지만, 코드를 재게시하는 경우 하우스 룰이 적용된다는 점을 기억하세요.
면책사항
해당 정보와 게시물은 금융, 투자, 트레이딩 또는 기타 유형의 조언이나 권장 사항으로 간주되지 않으며, 트레이딩뷰에서 제공하거나 보증하는 것이 아닙니다. 자세한 내용은 이용 약관을 참조하세요.
오픈 소스 스크립트
트레이딩뷰의 진정한 정신에 따라, 이 스크립트의 작성자는 이를 오픈소스로 공개하여 트레이더들이 기능을 검토하고 검증할 수 있도록 했습니다. 작성자에게 찬사를 보냅니다! 이 코드는 무료로 사용할 수 있지만, 코드를 재게시하는 경우 하우스 룰이 적용된다는 점을 기억하세요.
면책사항
해당 정보와 게시물은 금융, 투자, 트레이딩 또는 기타 유형의 조언이나 권장 사항으로 간주되지 않으며, 트레이딩뷰에서 제공하거나 보증하는 것이 아닙니다. 자세한 내용은 이용 약관을 참조하세요.