PROTECTED SOURCE SCRIPT
Checklist by Jaehee
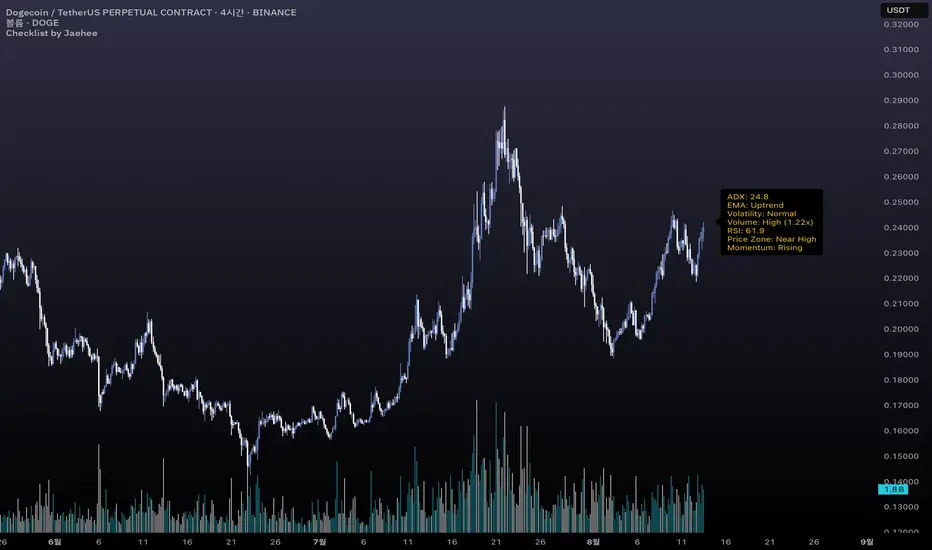
The checklist is a market context tool that consolidates seven key metrics into a single on-chart panel, helping traders quickly gauge market conditions without switching between multiple indicators.
1. Display Panel (7 metrics):
ADX: Trend intensity (Above 20 often indicates a stronger, more reliable trend)
EMA Structure: 5/20/60/120/240 EMA alignment (Uptrend, Downtrend, or Mixed state)
Volatility: ATR regime classification (High volatility may require wider stops)
Volume State: Relative to 20-bar SMA with spike multiple (High volume often confirms price moves)
RSI: Current RSI(14) value (Above 70 = overbought zone, below 30 = oversold zone)
Price Zone: Location within the last 20-bar range (Near High, Mid, or Near Low)
Momentum Slope: MACD histogram slope (Rising suggests building momentum; Falling suggests fading momentum)
2. Purpose & Use:
Designed for traders—especially beginners—who want to speed up market scanning.
Keeps a concise, standardized “checklist” visible on the right side of the chart.
Use as a contextual reference, not as an entry/exit signal.
3. Features:
Compact label HUD anchored to the chart’s right margin.
Automatic refresh on each bar close with only one label to avoid clutter.
Works on any timeframe and symbol that supports OHLCV data.
보호된 스크립트입니다
이 스크립트는 비공개 소스로 게시됩니다. 하지만 이를 자유롭게 제한 없이 사용할 수 있습니다 – 자세한 내용은 여기에서 확인하세요.
면책사항
해당 정보와 게시물은 금융, 투자, 트레이딩 또는 기타 유형의 조언이나 권장 사항으로 간주되지 않으며, 트레이딩뷰에서 제공하거나 보증하는 것이 아닙니다. 자세한 내용은 이용 약관을 참조하세요.
면책사항
해당 정보와 게시물은 금융, 투자, 트레이딩 또는 기타 유형의 조언이나 권장 사항으로 간주되지 않으며, 트레이딩뷰에서 제공하거나 보증하는 것이 아닙니다. 자세한 내용은 이용 약관을 참조하세요.