PROTECTED SOURCE SCRIPT
[TS] Enhanced MACD
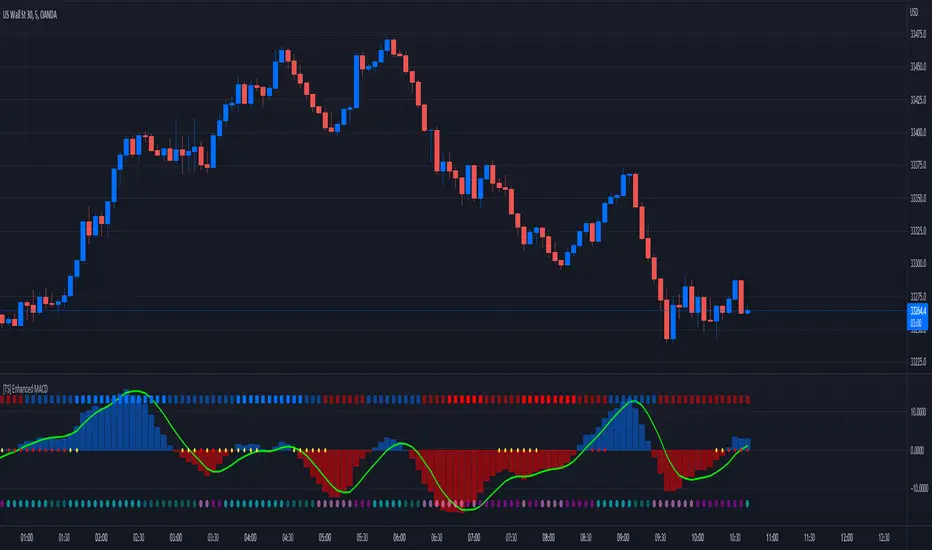
This is an Enhanced version of the standard MACD Indicator.
It displays the MACD Histogram as a normalized oscillator for a better visual representation (With values between -100 to 100)
On the top we have the WaveTrend indicator, showing the general trend of an asset (4 Color codings)
On 0 line, with red and yellow circles, is displayed the Contraption (or so-called Squeeze) of the price action.
When these circles appear a major shift in trend is expected.
On the bottom, we have another set of circles, which measure the price compression - These signal a period of very low price volatility.
보호된 스크립트입니다
이 스크립트는 비공개 소스로 게시됩니다. 하지만 이를 자유롭게 제한 없이 사용할 수 있습니다 – 자세한 내용은 여기에서 확인하세요.
Trusted Indicators
Visit: TrustedSignals.com or TrustedIndicators.com
Visit: TrustedSignals.com or TrustedIndicators.com
면책사항
해당 정보와 게시물은 금융, 투자, 트레이딩 또는 기타 유형의 조언이나 권장 사항으로 간주되지 않으며, 트레이딩뷰에서 제공하거나 보증하는 것이 아닙니다. 자세한 내용은 이용 약관을 참조하세요.