INVITE-ONLY SCRIPT
Takashi Divergence (RSI) | 2nd Gen | [Alerts]
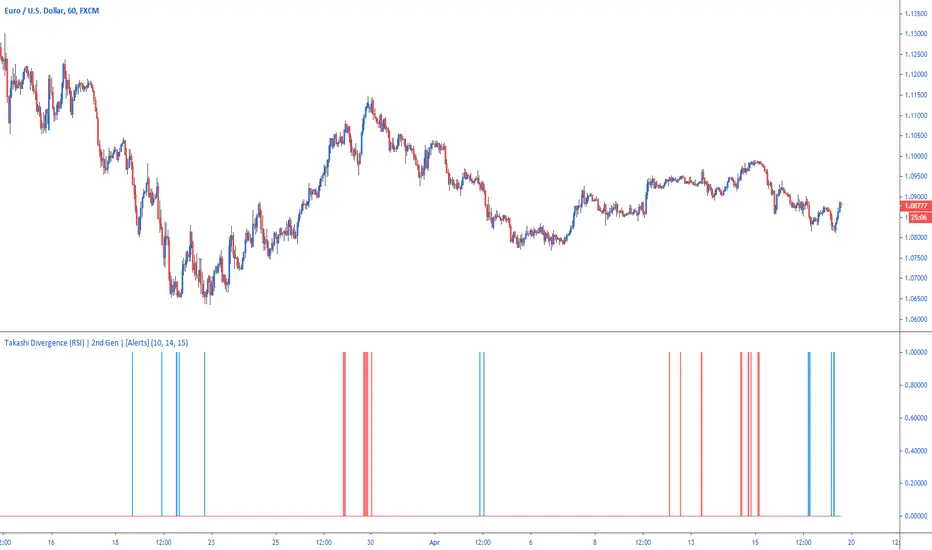
Easily highlight positive or negative divergence between price movement and RSI with Takashi-powered Divergence analysis.
Divergence strategy signals a potential reversal point because directional momentum does not confirm price. A bullish divergence occurs when the underlying market makes a lower low and RSI forms a higher low: RSI does not confirm the lower low and this shows strengthening momentum. A bearish divergence forms when the market records a higher high and RSI forms a lower high: RSI does not confirm the new high and this shows weakening momentum.
Inputs
Divergence Sensitivity
Float input. Sets a threshold after when the RSI divergence is triggered.
RSI Length
Integer input. The default setting used by most traders for the RSI is 14. That means that the indicator will go back 14 periods or time frames based on the chart being used (14 days on a Daily chart , 14 hours on an hourly chart and so forth) and make its calculation based on that.
Cross Distance
Integer input. Value from RSI that above or below 50 that classifies bullish or bearish levels. By default 15, that means the script will be checking for positive divergence when RSI is below 35 (50-15) and negative divergence when RSI is above 75 (50+15).
Use High & Low
Bool input. If true uses high and low values as RSI source.
To get access to this and other scripts check links below.
초대 전용 스크립트
이 스크립트는 작성자가 승인한 사용자만 접근할 수 있습니다. 사용하려면 요청 후 승인을 받아야 하며, 일반적으로 결제 후에 허가가 부여됩니다. 자세한 내용은 아래 작성자의 안내를 따르거나 kaiomp에게 직접 문의하세요.
트레이딩뷰는 스크립트의 작동 방식을 충분히 이해하고 작성자를 완전히 신뢰하지 않는 이상, 해당 스크립트에 비용을 지불하거나 사용하는 것을 권장하지 않습니다. 커뮤니티 스크립트에서 무료 오픈소스 대안을 찾아보실 수도 있습니다.
작성자 지시 사항
면책사항
해당 정보와 게시물은 금융, 투자, 트레이딩 또는 기타 유형의 조언이나 권장 사항으로 간주되지 않으며, 트레이딩뷰에서 제공하거나 보증하는 것이 아닙니다. 자세한 내용은 이용 약관을 참조하세요.