OPEN-SOURCE SCRIPT
업데이트됨 Average hourly move by @zeusbottrading
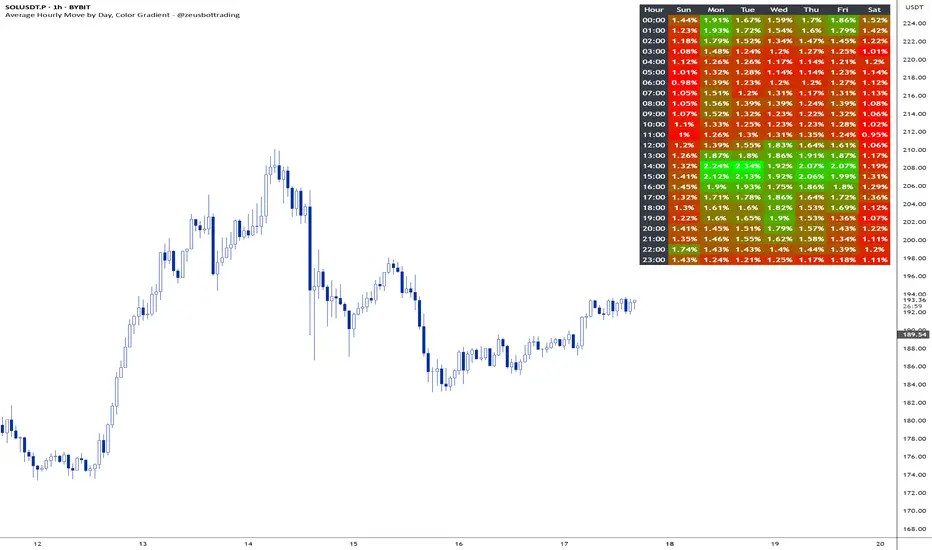
This Pine Script called "Average hourly move by zeusbottrading" calculates and displays the average percentage price movement for each hour of the day using the full available historical data.
How the script works:
It tracks the high and low price within each full hour (e.g., 10:00–10:59).
It calculates the percentage move as the range between high and low relative to the average price during that hour.
For each hour of the day, it stores the total of all recorded moves and the count of occurrences across the full history.
At the end, the script computes the average move for each hour (0 to 23) and determines the minimum and maximum averages.
Using these values, it creates a color gradient, where the hours with the lowest average volatility are red and the highest are green.
It then displays a table in the top-right corner of the chart showing each hour and its average percentage move, color‑coded according to volatility.
What it can be used for:
In short, this script is a useful tool for traders who want to fine‑tune their trading strategies and risk management by analyzing time‑based volatility profiles.
How the script works:
It tracks the high and low price within each full hour (e.g., 10:00–10:59).
It calculates the percentage move as the range between high and low relative to the average price during that hour.
For each hour of the day, it stores the total of all recorded moves and the count of occurrences across the full history.
At the end, the script computes the average move for each hour (0 to 23) and determines the minimum and maximum averages.
Using these values, it creates a color gradient, where the hours with the lowest average volatility are red and the highest are green.
It then displays a table in the top-right corner of the chart showing each hour and its average percentage move, color‑coded according to volatility.
What it can be used for:
- Identifying when the market is historically most volatile or calm during the day.
- Helping plan trade entries and exits based on expected volatility.
- Comparing hourly volatility patterns across different markets or instruments.
- Adjusting position size and risk management according to the anticipated volatility in a particular hour.
- Using long-term historical data to understand recurring daily volatility patterns.
In short, this script is a useful tool for traders who want to fine‑tune their trading strategies and risk management by analyzing time‑based volatility profiles.
릴리즈 노트
+ option to show days of the week and their hours in detail릴리즈 노트
+ minor edits오픈 소스 스크립트
트레이딩뷰의 진정한 정신에 따라, 이 스크립트의 작성자는 이를 오픈소스로 공개하여 트레이더들이 기능을 검토하고 검증할 수 있도록 했습니다. 작성자에게 찬사를 보냅니다! 이 코드는 무료로 사용할 수 있지만, 코드를 재게시하는 경우 하우스 룰이 적용된다는 점을 기억하세요.
면책사항
해당 정보와 게시물은 금융, 투자, 트레이딩 또는 기타 유형의 조언이나 권장 사항으로 간주되지 않으며, 트레이딩뷰에서 제공하거나 보증하는 것이 아닙니다. 자세한 내용은 이용 약관을 참조하세요.
오픈 소스 스크립트
트레이딩뷰의 진정한 정신에 따라, 이 스크립트의 작성자는 이를 오픈소스로 공개하여 트레이더들이 기능을 검토하고 검증할 수 있도록 했습니다. 작성자에게 찬사를 보냅니다! 이 코드는 무료로 사용할 수 있지만, 코드를 재게시하는 경우 하우스 룰이 적용된다는 점을 기억하세요.
면책사항
해당 정보와 게시물은 금융, 투자, 트레이딩 또는 기타 유형의 조언이나 권장 사항으로 간주되지 않으며, 트레이딩뷰에서 제공하거나 보증하는 것이 아닙니다. 자세한 내용은 이용 약관을 참조하세요.