OPEN-SOURCE SCRIPT
Moving Avareges Cross
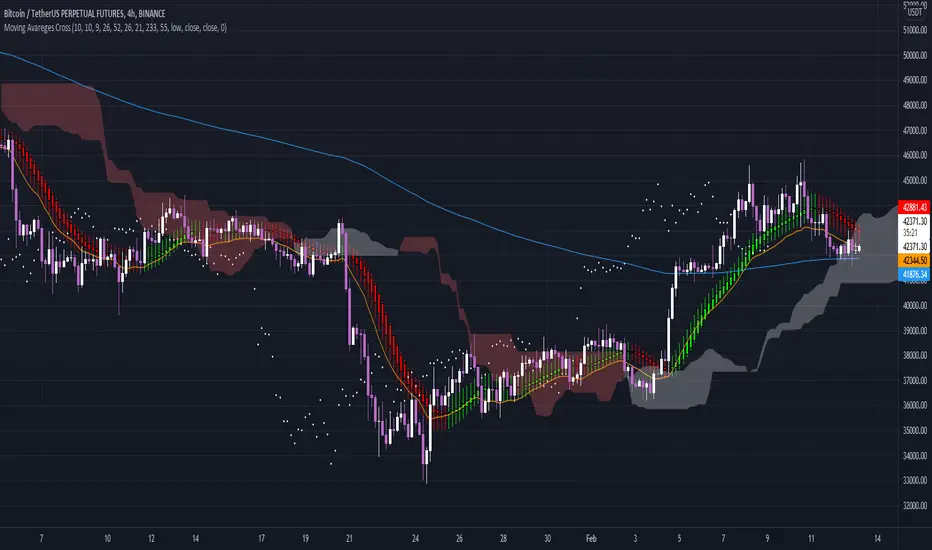
In this script I have combined 3 indicators Ichimoku, Heiken Ashi and Moving Average Exponential.
In this strategy, you should first look for the current market trend in low time frames.
Then look at the higher time frames to decide if you are in the right place to enter the trade.
For example, in 1 minute time frame, we first look at whether the two averages 21 and 233 had a cross or not.
If the moving average of 21 crosses the moving average of 233 from the bottom up and the end of the line moves the moving average of 233 upwards, it can be concluded
The market trend in time frame has changed for 1 minute and is up.
Then we refer to the time frames of 3, 5 and 15 minutes and check the same conditions there.
If 3 of the 4 time frames have the same conditions, we use Heiken Ashi to check the strength of the wave that is formed.
And also by looking at Ichimoku we will see where this Kumo cloud formed this wave.
If these conditions are met, a serious decision can be made to enter the position.
Higher time frames such as 30 minutes or 1 hour and 4 hours can also be used to find important resistance and support pivots.
In this way, the average of 233 and 21 and the formation of the current candlestick give us an acceptable range for fluctuation.
오픈 소스 스크립트
트레이딩뷰의 진정한 정신에 따라, 이 스크립트의 작성자는 이를 오픈소스로 공개하여 트레이더들이 기능을 검토하고 검증할 수 있도록 했습니다. 작성자에게 찬사를 보냅니다! 이 코드는 무료로 사용할 수 있지만, 코드를 재게시하는 경우 하우스 룰이 적용된다는 점을 기억하세요.
면책사항
해당 정보와 게시물은 금융, 투자, 트레이딩 또는 기타 유형의 조언이나 권장 사항으로 간주되지 않으며, 트레이딩뷰에서 제공하거나 보증하는 것이 아닙니다. 자세한 내용은 이용 약관을 참조하세요.
오픈 소스 스크립트
트레이딩뷰의 진정한 정신에 따라, 이 스크립트의 작성자는 이를 오픈소스로 공개하여 트레이더들이 기능을 검토하고 검증할 수 있도록 했습니다. 작성자에게 찬사를 보냅니다! 이 코드는 무료로 사용할 수 있지만, 코드를 재게시하는 경우 하우스 룰이 적용된다는 점을 기억하세요.
면책사항
해당 정보와 게시물은 금융, 투자, 트레이딩 또는 기타 유형의 조언이나 권장 사항으로 간주되지 않으며, 트레이딩뷰에서 제공하거나 보증하는 것이 아닙니다. 자세한 내용은 이용 약관을 참조하세요.