PROTECTED SOURCE SCRIPT
RSI of emas difference [ EEMANI ]
This strategy is found by error.
Initially I started to find the weekly version of RSIofVWAP strategy. somehow I didn't see good results. Then , on the same script I did change it to find rsi emas difference strategy.
while changing the code , for the long term ema /slow ema input , I had entered fastema value instead of the price close. That is the error.
But strategy showed good results , then I extended it to add stop loss and take profits. Since this is found by error, I cant explain much how it is working.
Please check if your symbol works with this strategy and let me know ... your feedback is greatly appreciated to improve the strategy ...
I name it as EEMANI strategy
BUY
======
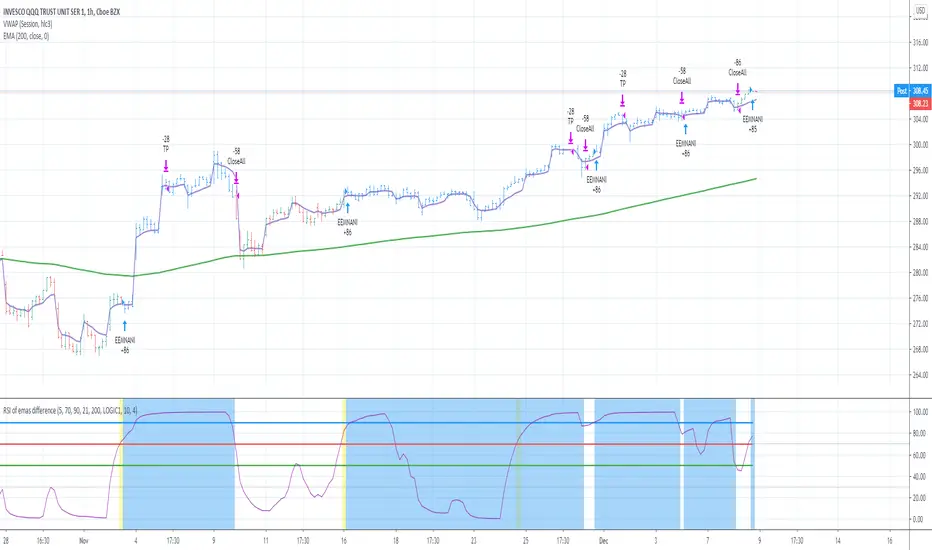
When the RSIofEMAsdiff is crossing above 70 (buy Line) and fastEma is rising
Note:
On the indicator it shows yellow background ... thats the entry point ....
when strategy is already in Long position , if you see yellow back ground thats where you can add or enter if you missed earlier signal
background and bar color color changes to blue when strategy is in Long position
Partial Exit
=========
when RSI value reaches 99 , 1/3 of the position si closed with profit
Close
======
when RSI value crossing down 90 (exitLine)
Stop Loss
=========
defaulted to 4% (increasing this value might improve the performance , but number of bars will go high , that means you need to wait longer time to get out of the trade ... Thats boring !!!
Note :
I have added two formulas , both of them are produce similar results. But different equities on different logic. check which formula is working for you
LOGIC1 => fastEMAval-slowEMAval
LOGIC2 => (slowEMAval+fastEMAval)/weeklyVwap
Warning
=========
For the use of educational purposes only
Initially I started to find the weekly version of RSIofVWAP strategy. somehow I didn't see good results. Then , on the same script I did change it to find rsi emas difference strategy.
while changing the code , for the long term ema /slow ema input , I had entered fastema value instead of the price close. That is the error.
But strategy showed good results , then I extended it to add stop loss and take profits. Since this is found by error, I cant explain much how it is working.
Please check if your symbol works with this strategy and let me know ... your feedback is greatly appreciated to improve the strategy ...
I name it as EEMANI strategy
BUY
======
When the RSIofEMAsdiff is crossing above 70 (buy Line) and fastEma is rising
Note:
On the indicator it shows yellow background ... thats the entry point ....
when strategy is already in Long position , if you see yellow back ground thats where you can add or enter if you missed earlier signal
background and bar color color changes to blue when strategy is in Long position
Partial Exit
=========
when RSI value reaches 99 , 1/3 of the position si closed with profit
Close
======
when RSI value crossing down 90 (exitLine)
Stop Loss
=========
defaulted to 4% (increasing this value might improve the performance , but number of bars will go high , that means you need to wait longer time to get out of the trade ... Thats boring !!!
Note :
I have added two formulas , both of them are produce similar results. But different equities on different logic. check which formula is working for you
LOGIC1 => fastEMAval-slowEMAval
LOGIC2 => (slowEMAval+fastEMAval)/weeklyVwap
Warning
=========
For the use of educational purposes only
보호된 스크립트입니다
이 스크립트는 비공개 소스로 게시됩니다. 하지만 이를 자유롭게 제한 없이 사용할 수 있습니다 – 자세한 내용은 여기에서 확인하세요.
면책사항
해당 정보와 게시물은 금융, 투자, 트레이딩 또는 기타 유형의 조언이나 권장 사항으로 간주되지 않으며, 트레이딩뷰에서 제공하거나 보증하는 것이 아닙니다. 자세한 내용은 이용 약관을 참조하세요.
면책사항
해당 정보와 게시물은 금융, 투자, 트레이딩 또는 기타 유형의 조언이나 권장 사항으로 간주되지 않으며, 트레이딩뷰에서 제공하거나 보증하는 것이 아닙니다. 자세한 내용은 이용 약관을 참조하세요.