PROTECTED SOURCE SCRIPT
Momentum, Trend and Volatility indicator by [Th16rry]
Momentum, Trend and Volatility indicator by [Th16rry]
Description:
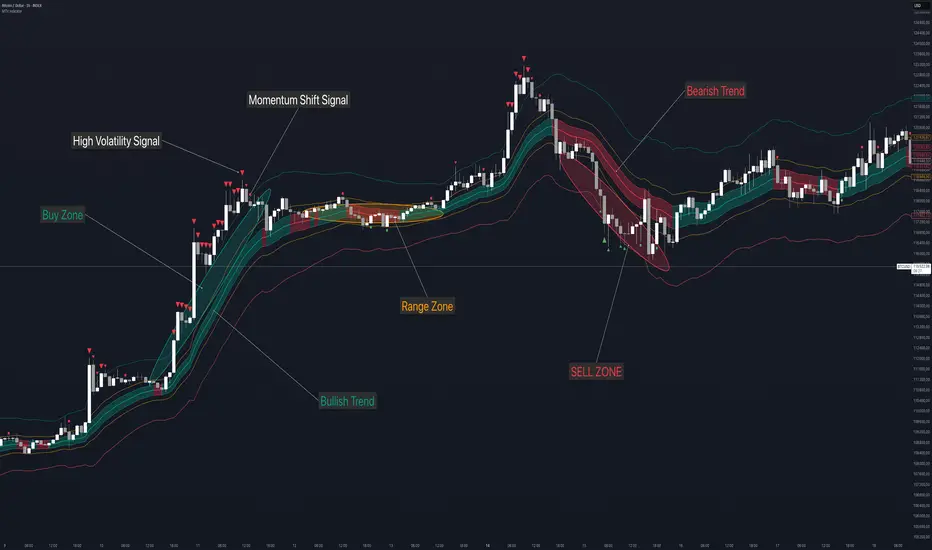
Momentum, Trend and Volatility indicator by [Th16rry] is an advanced TradingView indicator designed to clearly identify market bias, volatility, and momentum directly on your charts. It integrates multiple analytical techniques, combining adaptive moving averages, volatility bands, and momentum signals into a unified visual framework.
Key Components:
Adaptive Moving Average (Nadaraya–Watson): A sophisticated, non-repainting adaptive moving average colored dynamically to instantly show bullish or bearish trends. This component highlights the prevailing market bias.
Trend Channel: Built around a central Keltner Channel with a customizable multiplier, this channel captures immediate price trends. When price remains within this channel, it indicates sustained market direction.
Volatility Channel: Represented by broader bands using a higher ATR multiplier. Price movements crossing outside these channels suggest significant volatility spikes, often signaling potential market reversals or strong breakout moves.
Range Channel: A medium ATR multiplier channel designed to pinpoint potential consolidation or ranging conditions. Useful for identifying short-term trading ranges or preparation phases before major moves.
CCI Momentum Signals: Includes optional Commodity Channel Index (CCI) signals to identify momentum shifts. Arrows appear when CCI crosses predefined thresholds, signaling potential overbought or oversold conditions.
How to Use:
Trend Following: Enter trades aligned with the adaptive moving average color. A teal line indicates bullish conditions, while a red line suggests bearish sentiment. Use Trend Channel
to spot Breakouts and pull-backs.
Volatility Breakouts: Pay attention to arrows marking price breaches beyond the Volatility Channel. Upward (red) and downward (green) arrows highlight significant breakout or reversal opportunities.
Range Trading: Utilize the Range Channel to trade sideways markets. Price reactions near these boundaries can offer quick reversal trade setups or scalping opportunities. Or simply avoid any trading during these low volatility phases.
Momentum Entries: Enable CCI signals to catch momentum-based trades. Green circles indicate bullish momentum turning points; red circles indicate bearish momentum shifts.
Customization:
Momentum, Trend and Volatility indicator by [Th16rry] provides full customization to fit individual trading styles:
Adjust ATR multipliers to control channel widths.
Configure Nadaraya–Watson parameters for sensitivity.
Enable or disable visual elements such as channel backgrounds or CCI signals to maintain chart clarity.
This indicator serves as a comprehensive trading tool for traders looking to enhance their strategy through a clear understanding of market dynamics, including trend strength, volatility bursts, and momentum shifts.
Disclaimer:
Trading involves significant risk of loss and is not suitable for every investor. Always use proper risk management strategies. This Indicator is provided for educational purposes only and does not constitute financial advice or recommendations to trade specific assets. Users should conduct their own research and consult a licensed financial advisor before making trading decisions.
Description:
Momentum, Trend and Volatility indicator by [Th16rry] is an advanced TradingView indicator designed to clearly identify market bias, volatility, and momentum directly on your charts. It integrates multiple analytical techniques, combining adaptive moving averages, volatility bands, and momentum signals into a unified visual framework.
Key Components:
Adaptive Moving Average (Nadaraya–Watson): A sophisticated, non-repainting adaptive moving average colored dynamically to instantly show bullish or bearish trends. This component highlights the prevailing market bias.
Trend Channel: Built around a central Keltner Channel with a customizable multiplier, this channel captures immediate price trends. When price remains within this channel, it indicates sustained market direction.
Volatility Channel: Represented by broader bands using a higher ATR multiplier. Price movements crossing outside these channels suggest significant volatility spikes, often signaling potential market reversals or strong breakout moves.
Range Channel: A medium ATR multiplier channel designed to pinpoint potential consolidation or ranging conditions. Useful for identifying short-term trading ranges or preparation phases before major moves.
CCI Momentum Signals: Includes optional Commodity Channel Index (CCI) signals to identify momentum shifts. Arrows appear when CCI crosses predefined thresholds, signaling potential overbought or oversold conditions.
How to Use:
Trend Following: Enter trades aligned with the adaptive moving average color. A teal line indicates bullish conditions, while a red line suggests bearish sentiment. Use Trend Channel
to spot Breakouts and pull-backs.
Volatility Breakouts: Pay attention to arrows marking price breaches beyond the Volatility Channel. Upward (red) and downward (green) arrows highlight significant breakout or reversal opportunities.
Range Trading: Utilize the Range Channel to trade sideways markets. Price reactions near these boundaries can offer quick reversal trade setups or scalping opportunities. Or simply avoid any trading during these low volatility phases.
Momentum Entries: Enable CCI signals to catch momentum-based trades. Green circles indicate bullish momentum turning points; red circles indicate bearish momentum shifts.
Customization:
Momentum, Trend and Volatility indicator by [Th16rry] provides full customization to fit individual trading styles:
Adjust ATR multipliers to control channel widths.
Configure Nadaraya–Watson parameters for sensitivity.
Enable or disable visual elements such as channel backgrounds or CCI signals to maintain chart clarity.
This indicator serves as a comprehensive trading tool for traders looking to enhance their strategy through a clear understanding of market dynamics, including trend strength, volatility bursts, and momentum shifts.
Disclaimer:
Trading involves significant risk of loss and is not suitable for every investor. Always use proper risk management strategies. This Indicator is provided for educational purposes only and does not constitute financial advice or recommendations to trade specific assets. Users should conduct their own research and consult a licensed financial advisor before making trading decisions.
보호된 스크립트입니다
이 스크립트는 비공개 소스로 게시됩니다. 하지만 이를 자유롭게 제한 없이 사용할 수 있습니다 – 자세한 내용은 여기에서 확인하세요.
면책사항
해당 정보와 게시물은 금융, 투자, 트레이딩 또는 기타 유형의 조언이나 권장 사항으로 간주되지 않으며, 트레이딩뷰에서 제공하거나 보증하는 것이 아닙니다. 자세한 내용은 이용 약관을 참조하세요.
면책사항
해당 정보와 게시물은 금융, 투자, 트레이딩 또는 기타 유형의 조언이나 권장 사항으로 간주되지 않으며, 트레이딩뷰에서 제공하거나 보증하는 것이 아닙니다. 자세한 내용은 이용 약관을 참조하세요.