INVITE-ONLY SCRIPT
업데이트됨 BandPercentile [Orderflowing]
BandPercentile | Bollinger Band Analysis | Bandpass Filtering | Customizable (+)
Built using Pine Script V5.
Introduction
The BandPercentile indicator is a technical analysis tool that improves the traditional Bollinger Bands as a Percentile concept.
Inspiration and Evolution
The BandPercentile was born of the simplicity of calculating the Bollinger Bands Percentile.
It evolves this concept by addressing a need for greater customization and precision.
The integration of the Experimental version of the Bandpass Filter & Super Smoothing, a concept by John Ehlers, adds a layer of sophistication - allowing for a different view.
Core Functionality
The BandPercentile calculates percentile values based on the position of the price within the Bollinger Bands, offering a way to see overbought and oversold market conditions.
The indicator is designed to provide clear visual cues for market extremes, aiding in decision-making for entries and exits.
These market extremes or overbought/sold levels are fully customizable.
Unique Features and Customization
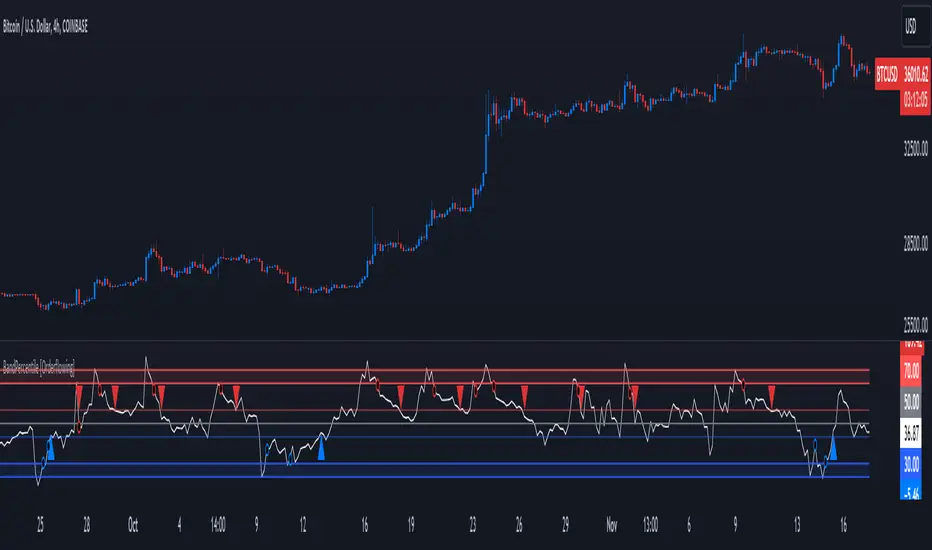
Example of 2 pole bandpass filtering on daily calculation / 4 hour chart:

Example of 3 pole bandpass filtering on daily calculation / 4 hour chart:

Analysis and Interpretation
The indicator provides a scale, ranging from extreme overbought to extreme oversold levels, with customizable levels for divergence/confirmed trend shift analysis.
This scale is useful for traders to understand market sentiment and potential reversal points.
Interpretation and Visuals
The BandPercentile indicator is designed with a clear, color-coded system for better readability and quick interpretation:
Multi-Timeframe
The indicator's flexibility allows for application across most asset classes and timeframes, making it suitable for different trading strategies, from day trading to long-term investing.
Example using the Daily BandPercentile on a 4H chart:

Trading Style
Whether you are a momentum trader, swing trader, or a long-term investor.
The BandPercentile can be made to suit diverse trading styles and risk parameters.
Usage and Applications
The Value
BandPercentile stands out as an innovative tool.
It also respects the individuality of each trader's approach.
Its advanced filtering and customization capabilities makes it valuable.
Conclusion
The BandPercentile indicator is a useful tool for traders to optimize their strategy.
Its unique blend of traditional concepts and modern filtering techniques makes it one-of-a-kind.
Do not solely rely on the signals from the BandPercentile.
The indicator is meant to be used as confluence to your existing strategy.
Built using Pine Script V5.
Introduction
The BandPercentile indicator is a technical analysis tool that improves the traditional Bollinger Bands as a Percentile concept.
Inspiration and Evolution
The BandPercentile was born of the simplicity of calculating the Bollinger Bands Percentile.
It evolves this concept by addressing a need for greater customization and precision.
The integration of the Experimental version of the Bandpass Filter & Super Smoothing, a concept by John Ehlers, adds a layer of sophistication - allowing for a different view.
Core Functionality
The BandPercentile calculates percentile values based on the position of the price within the Bollinger Bands, offering a way to see overbought and oversold market conditions.
The indicator is designed to provide clear visual cues for market extremes, aiding in decision-making for entries and exits.
These market extremes or overbought/sold levels are fully customizable.
Unique Features and Customization
- Overbought/Oversold Dots: Visual markers for identifying critical market thresholds.
- Divergence Detection: Highlights potential bullish and bearish divergences, aiding in predictive analysis.
- Multiple Moving Average Types: Choose from SMA, Hull, Dema, EMA, WMA, and LINREG for calculations.
- Customizable Parameters: Adjust length, multiplier, and overbought/oversold levels to fit various trading styles.
- Roofing Filter Integration: Incorporates Ehlers' Bandpass Filter for signal processing.
Example of 2 pole bandpass filtering on daily calculation / 4 hour chart:
Example of 3 pole bandpass filtering on daily calculation / 4 hour chart:
Analysis and Interpretation
The indicator provides a scale, ranging from extreme overbought to extreme oversold levels, with customizable levels for divergence/confirmed trend shift analysis.
This scale is useful for traders to understand market sentiment and potential reversal points.
Interpretation and Visuals
The BandPercentile indicator is designed with a clear, color-coded system for better readability and quick interpretation:
- Primary Overbought and Oversold Lines: These are marked in red and blue, respectively, to signify the most critical overbought and oversold levels.
- Extended Overbought and Oversold Lines: Additional red and blue lines represent extended overbought and oversold levels, showing more extreme market conditions.
- Middle Line: This line acts as a central balance point, providing a reference for the current market state relative to overbought and oversold conditions.
- Intermediate Middle Levels: These are additional lines marked in lighter shades of blue and red, indicating lower mid and higher mid levels that can signal emerging trends or potential reversals.
- Markers: Distinct shapes are used to highlight potential trend reversals, helping with identifying opportunities.
Multi-Timeframe
The indicator's flexibility allows for application across most asset classes and timeframes, making it suitable for different trading strategies, from day trading to long-term investing.
Example using the Daily BandPercentile on a 4H chart:
Trading Style
Whether you are a momentum trader, swing trader, or a long-term investor.
The BandPercentile can be made to suit diverse trading styles and risk parameters.
Usage and Applications
- Market Extremes Identification - Pinpoint overbought and oversold conditions.
- Divergence Analysis - Detect potential trend reversals before they occur.
- Customizable Analysis - Edit the indicator inputs to align with personal trading strategies and preferences.
The Value
BandPercentile stands out as an innovative tool.
It also respects the individuality of each trader's approach.
Its advanced filtering and customization capabilities makes it valuable.
Conclusion
The BandPercentile indicator is a useful tool for traders to optimize their strategy.
Its unique blend of traditional concepts and modern filtering techniques makes it one-of-a-kind.
Do not solely rely on the signals from the BandPercentile.
The indicator is meant to be used as confluence to your existing strategy.
릴리즈 노트
V1.1 - Added inputs to show/hide arrows, early reversals & divergences.Added color customization for arrows and divergence dots.
Fixed divergence logic to detect and display regular and hidden divergences with labels.
Updated tooltips and input settings for improved user experience.
릴리즈 노트
V1.1.1 - Trend Flip Logic Rework, Changed Default Inputs & Settings.릴리즈 노트
V1.2 - Adjusted Line Logic릴리즈 노트
V1.3 - Pine Script™ v6 Update초대 전용 스크립트
이 스크립트는 작성자가 승인한 사용자만 접근할 수 있습니다. 사용하려면 요청 후 승인을 받아야 하며, 일반적으로 결제 후에 허가가 부여됩니다. 자세한 내용은 아래 작성자의 안내를 따르거나 Orderflowing에게 직접 문의하세요.
트레이딩뷰는 스크립트의 작동 방식을 충분히 이해하고 작성자를 완전히 신뢰하지 않는 이상, 해당 스크립트에 비용을 지불하거나 사용하는 것을 권장하지 않습니다. 커뮤니티 스크립트에서 무료 오픈소스 대안을 찾아보실 수도 있습니다.
작성자 지시 사항
To start using this script, please visit our site: https://orderflowing.com for access.
William | Orderflowing
Develop Edge For Markets™
Indicators:
tradingview.com/u/Orderflowing/
orderflowing.com/indicators
Get Instant Access: orderflowing.com/pricing
Develop Edge For Markets™
Indicators:
tradingview.com/u/Orderflowing/
orderflowing.com/indicators
Get Instant Access: orderflowing.com/pricing
면책사항
해당 정보와 게시물은 금융, 투자, 트레이딩 또는 기타 유형의 조언이나 권장 사항으로 간주되지 않으며, 트레이딩뷰에서 제공하거나 보증하는 것이 아닙니다. 자세한 내용은 이용 약관을 참조하세요.
초대 전용 스크립트
이 스크립트는 작성자가 승인한 사용자만 접근할 수 있습니다. 사용하려면 요청 후 승인을 받아야 하며, 일반적으로 결제 후에 허가가 부여됩니다. 자세한 내용은 아래 작성자의 안내를 따르거나 Orderflowing에게 직접 문의하세요.
트레이딩뷰는 스크립트의 작동 방식을 충분히 이해하고 작성자를 완전히 신뢰하지 않는 이상, 해당 스크립트에 비용을 지불하거나 사용하는 것을 권장하지 않습니다. 커뮤니티 스크립트에서 무료 오픈소스 대안을 찾아보실 수도 있습니다.
작성자 지시 사항
To start using this script, please visit our site: https://orderflowing.com for access.
William | Orderflowing
Develop Edge For Markets™
Indicators:
tradingview.com/u/Orderflowing/
orderflowing.com/indicators
Get Instant Access: orderflowing.com/pricing
Develop Edge For Markets™
Indicators:
tradingview.com/u/Orderflowing/
orderflowing.com/indicators
Get Instant Access: orderflowing.com/pricing
면책사항
해당 정보와 게시물은 금융, 투자, 트레이딩 또는 기타 유형의 조언이나 권장 사항으로 간주되지 않으며, 트레이딩뷰에서 제공하거나 보증하는 것이 아닙니다. 자세한 내용은 이용 약관을 참조하세요.