PROTECTED SOURCE SCRIPT
Trend Band
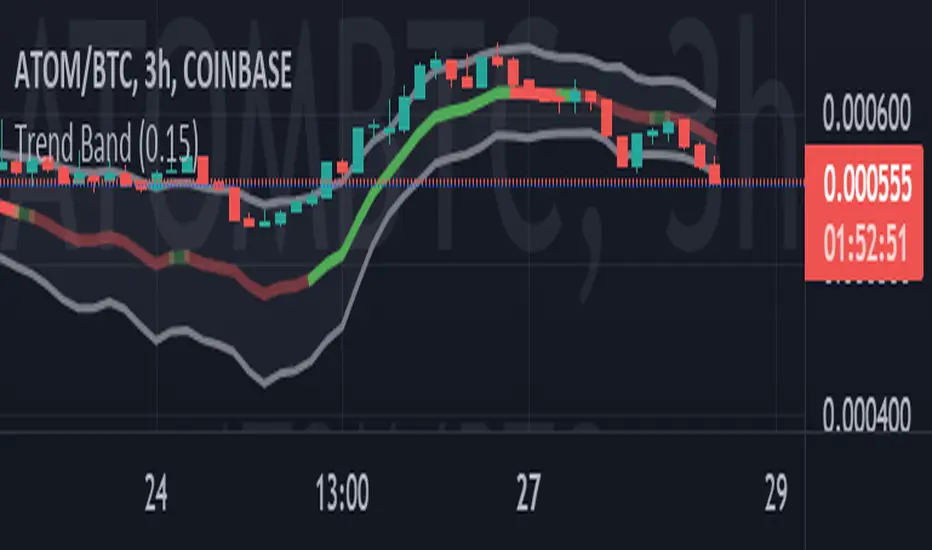
The volume-weighted, exponential running mean is computed. It is shown as the thick line. The plus-minus one standard deviation band is also shown with two thinner lines.
In contrast to other RAs, it is the trading volumes that are being processed here instead of the price itself.
For the averaging, the weight of the present relative to the past can be chosen by the user. It’s a number between 0 and 1. There are no other (hidden) parameters.
A price outside the band may be an indication that the security is overbought or oversold. It can also be an indication of a beginning trend. Disclaimer: No miracles!
Two alerts are included and act accordingly.
The color of the mean line comes from the derivative averaged the same way. The second derivative (reversals) is still to come.
보호된 스크립트입니다
이 스크립트는 비공개 소스로 게시됩니다. 하지만 이를 자유롭게 제한 없이 사용할 수 있습니다 – 자세한 내용은 여기에서 확인하세요.
면책사항
해당 정보와 게시물은 금융, 투자, 트레이딩 또는 기타 유형의 조언이나 권장 사항으로 간주되지 않으며, 트레이딩뷰에서 제공하거나 보증하는 것이 아닙니다. 자세한 내용은 이용 약관을 참조하세요.
면책사항
해당 정보와 게시물은 금융, 투자, 트레이딩 또는 기타 유형의 조언이나 권장 사항으로 간주되지 않으며, 트레이딩뷰에서 제공하거나 보증하는 것이 아닙니다. 자세한 내용은 이용 약관을 참조하세요.