OPEN-SOURCE SCRIPT
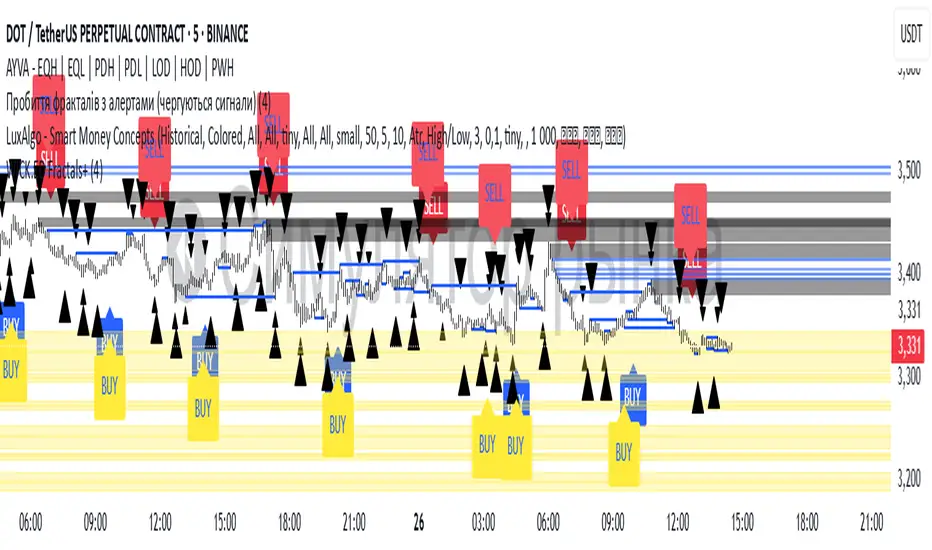
Williams Fractals with Buy/Sell Signals
🧠 Concept:
This indicator is based on the concept of fractal swing highs and lows, commonly used in Bill Williams’ trading methods. A fractal forms when a candle’s high or low is higher/lower than a set number of candles on both sides. This structure helps identify local market turning points.
⚙️ Inputs:
Fractal Sensitivity (swingSensitivity):
Number of candles required on each side of the central bar to validate a fractal.
For example, if set to 2, a swing high is detected when a bar’s high is higher than the previous 2 bars and the next 2 bars.
✅ Features:
Fractal Detection:
Plots white triangles above swing highs (down fractals).
Plots white triangles below swing lows (up fractals).
Buy/Sell Signals:
Buy Signal: Triggered when the candle closes above the most recent down fractal.
Sell Signal: Triggered when the candle closes below the most recent up fractal.
Signals alternate — a Buy must follow a Sell and vice versa to reduce noise.
Signal Labels:
"BUY" label appears below the candle in green.
"SELL" label appears above the candle in red.
Alerts:
Real-time alerts are available for both Buy and Sell signals via alertcondition().
📌 Use Case:
This indicator can help you:
Detect short-term reversals.
Confirm breakouts or structure shifts.
Time entries with clear logic based on price action.
오픈 소스 스크립트
트레이딩뷰의 진정한 정신에 따라, 이 스크립트의 작성자는 이를 오픈소스로 공개하여 트레이더들이 기능을 검토하고 검증할 수 있도록 했습니다. 작성자에게 찬사를 보냅니다! 이 코드는 무료로 사용할 수 있지만, 코드를 재게시하는 경우 하우스 룰이 적용된다는 점을 기억하세요.
면책사항
해당 정보와 게시물은 금융, 투자, 트레이딩 또는 기타 유형의 조언이나 권장 사항으로 간주되지 않으며, 트레이딩뷰에서 제공하거나 보증하는 것이 아닙니다. 자세한 내용은 이용 약관을 참조하세요.
오픈 소스 스크립트
트레이딩뷰의 진정한 정신에 따라, 이 스크립트의 작성자는 이를 오픈소스로 공개하여 트레이더들이 기능을 검토하고 검증할 수 있도록 했습니다. 작성자에게 찬사를 보냅니다! 이 코드는 무료로 사용할 수 있지만, 코드를 재게시하는 경우 하우스 룰이 적용된다는 점을 기억하세요.
면책사항
해당 정보와 게시물은 금융, 투자, 트레이딩 또는 기타 유형의 조언이나 권장 사항으로 간주되지 않으며, 트레이딩뷰에서 제공하거나 보증하는 것이 아닙니다. 자세한 내용은 이용 약관을 참조하세요.